Figure 3.
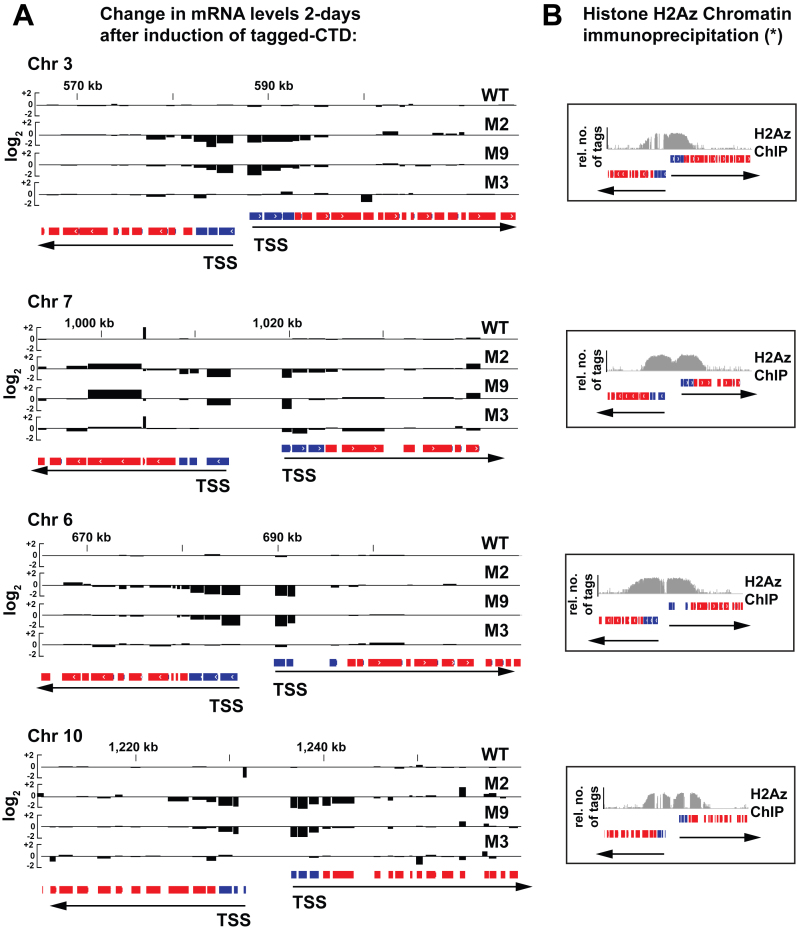
Small clusters of mutations in the RNA Pol II CTD result in reduced RNA abundance within TSS-proximal genes. (A) Representative examples of transcript production at TSS-proximal and -distal regions on chromosomes 3, 7, 6 and 10 in cell lines WTTy1, M2Ty1, M9Ty1 and M3Ty1. Black bar plots show gene expression changes after 2 days of tetracycline-induced tagged RNA Pol II production relative to uninduced cells (log2-fold changes in Fragments Per Kilobase of transcript per Million mapped reads). The blue blocks denote TSS-proximal protein-coding genes. The red blocks denote TSS-distal protein-coding genes. The black arrows indicate the direction of transcription of polygenic units. The two sets of blue blocks in opposite orientations flank two divergently arranged TSSs. (B) Representative data showing that the ∼10 kb genomic loci, which include TSS regions, are marked by specific histone variants and histone modifications in wild-type T. brucei. Asterisk (*) indicates data is from Siegel et al. (2009). The variant histone H2Az occupancy (gray histograms) on regions shown corresponds to those in panel (A).

