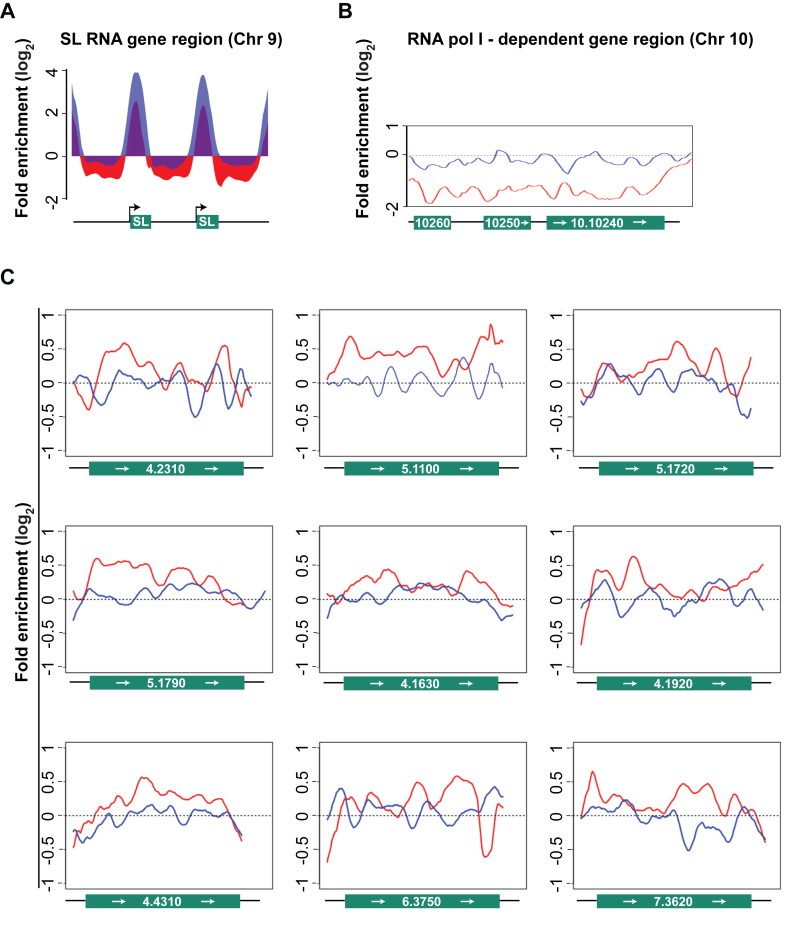
Figure 4.
ChIP-Seq analyses of RNA pol II engagement in WTTy1 and M2Ty1 cells. In all panels data from WTTy1 are red and data from M2Ty1 are blue. (A) Histograms of RNA pol II ChIP-enrichment relative to total DNA, on SL RNA genes in WTTy1 and M2Ty1 cells. A 4-kb region on chromosome 9, covering two SL RNA gene repeats (green boxes) plus flanking sequences (black line), is shown. Black arrows indicate direction of SL RNA transcription. The y-axis represents estimated ChIP enrichment (log2) relative to total DNA at each position based on smoothed tag density in each dataset. (B) Line plots show RNA pol II occupancy did not occur within RNAP I-dependent protein coding genes in either WTTy1 or M2Ty1 cells. An ∼10 kb region on chromosome 10, containing procyclins (EP1 and EP2; 10.10260 and 10.10250), procyclin-associated gene (PAG1; 10.10240) and flanking sequences (black line) is shown. The y-axis is as in (A). (C) Line plots show RNA pol II occupancy relative to total DNA, as in (A), on nine protein-coding genes that are expressed at high levels (above 90 percentile in RNA-Seq analysis; source is TriTrypDB) and are not within the TSS regions of any polygenic gene arrays. Gene IDs are shown as chromosome number followed by gene number. Each plot covers the entire coding region of the respective gene plus 200 base pair flanking sequences. Each of these genes are between 60 and 300 kb downstream from the first protein coding gene of the polygenic array in which they are embedded. These data show examples that WT Ty1 and M2Ty1 RNA pol II occupancy are often relatively the same at regions 60–300 kb downstream from the first protein-coding gene.

