
Figure 3.
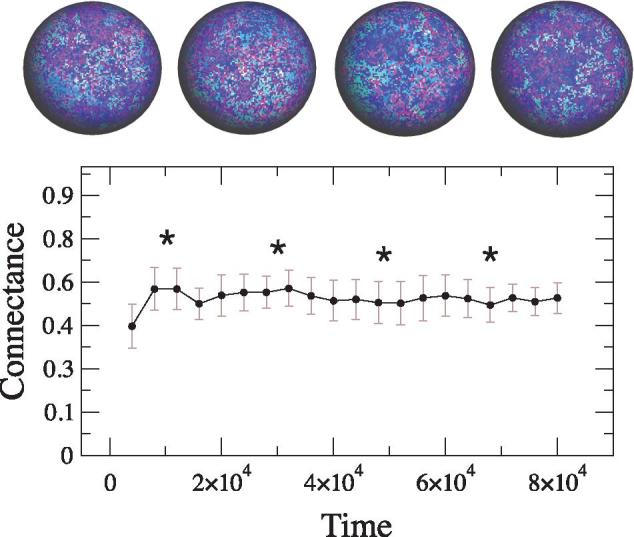
Temporal dynamics of connectance in a typical run of the model. The connectance stabilizes around a well-defined average value C ≈ 0.45. This density of links allows for a high diversity of possible system configurations. From left to right, the snapshots (whose location is pointed with stars in the curve) display an evolving pattern of spatial heterogeneity. Here, we use the same parameters described in the main text.