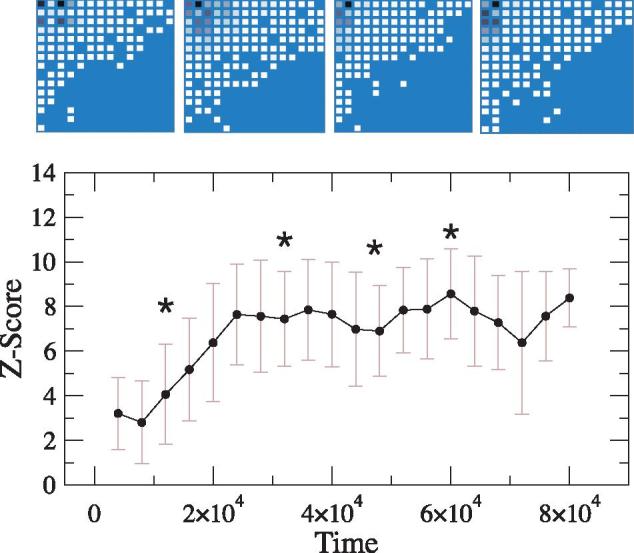
Figure 4.

Temporal dynamics of the statistical significance of nestedness. After an initial transient period, the global organization of the γ-matrix settles in stable nested patterns (the average Z ≈ 5). The top row shows several snapshots of the bacteria–phage interaction network taken at different evolutionary stages (whose location is given by stars in the curve). Both the binary structure and the quantitative preference matrix are significantly nested. The matrix at time t has been obtained by first counting the frequency of interactions Bi,j observed in the time period [t– Δt,t] (here Δt = 2000 time steps) and then discarding the mass action term (xixj). In each matrix, darker colors represent higher interaction preferences. Tests for nestedness are based in the null model described in the main text.
