
Figure 5.
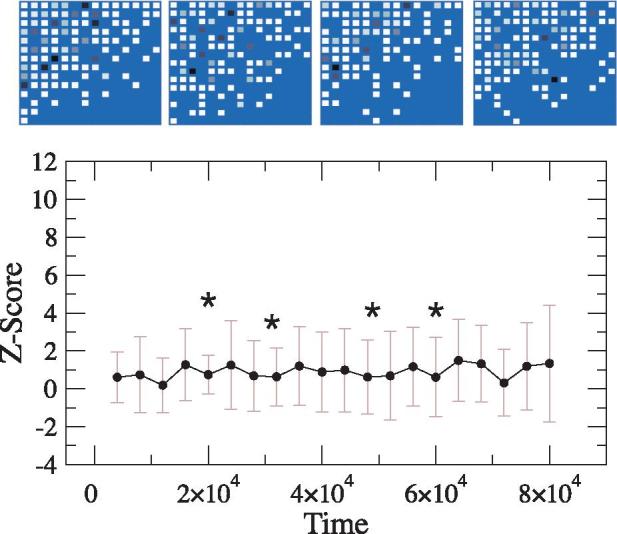
In the absence of space, the model does not tend to a pattern of significant nestedness (the average Z ≈ 0). The top row shows several snapshots of the host–phage interaction network taken at different evolutionary stages (whose location is given by stars in the curve). The binary structure of these matrices is nested but the quantitative preferences are found to be distributed in an anti-nested manner. The matrix at time t has been obtained by aggregating the interactions observed in the time period [t– Δt,t] (here Δt = 2000 time steps). In each matrix, darker colors represent higher preference of interactions. Tests for nestedness are based in the null model described in the main text.