Figure 1.
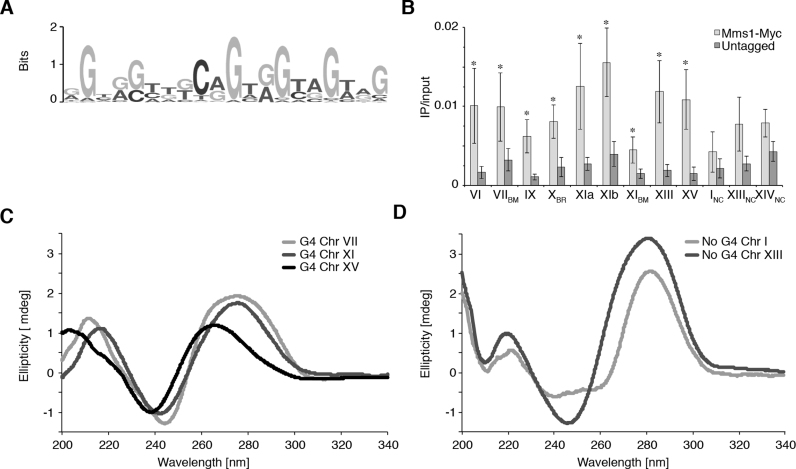
Mms1 associates with G-rich regions in vivo. (A) G-rich binding motif of Mms1 identified by MEME-ChIP search. (B) Validation and characterization of ChIPseq data. Using Myc-tagged Mms1 conventional ChIP and qPCR was performed using primers directed against endogenous regions. Regions are indicated below graph. Detail on regions and primers are listed in Supplementary data 3. Three regions identified as Mms1 binding sites by ChIPseq were tested (Chr VIIBM, XBR, XIBM) as well as nine additional genomic regions. Sites that contain the specific G-rich binding motif identified by MEME are marked with BM, additional G-rich binding regions identified by ChIP-seq with BR and negative controls with NC. Plotted are IP/input values as mean value ± standard deviation (SD). N≥3 biological replicates. Statistical significance compared to untagged cells was determined by Student's t-test. *P < 0.05. (C) CD analysis of the three Mms1 binding regions. (D) CD analysis of the two negative controls. The CD spectrum of a folded parallel G4 structure has a specific maximum and minimum (264 nm and 243 nm, respectively) which differs from the maximum and minimum of B-DNA (245 and 290 nm, respectively) (62,63). See Supplementary data 7 for details of analyzed regions and sequences. Shown are the ellipticity (in mdeg) values. This analysis demonstrates that G-rich Mms1 binding regions, harboring a G4tract2, can form G4 DNA structures.

