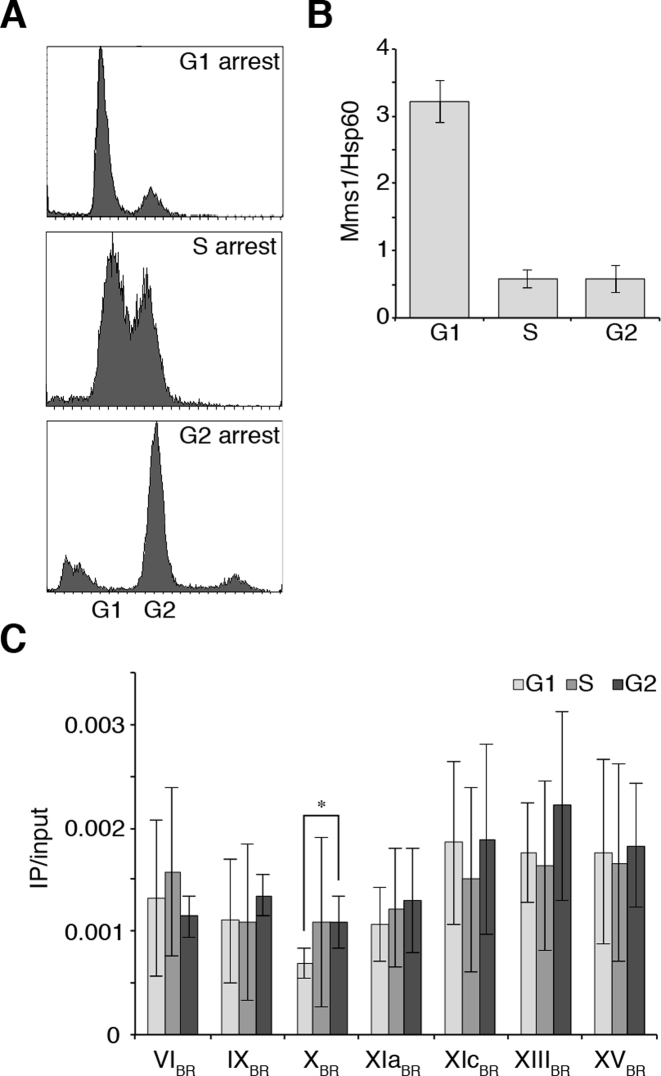
Figure 2.
Mms1 protein levels are highest in G1 phase and Mms1 binds throughout cell cycle. (A) FACS analysis of cells arrested in G1, S or G2 phase. Cells were arrested in G1 by treatment with α-factor, in S phase by HU and in G2 by nocadozole. (B) Western blot analysis of Myc-tagged Mms1 protein levels in G1, S and G2 phase. Level of Mms1 was quantified using Hsp60 as a reference protein. Shown are mean Myc-tagged Mms1 levels normalized to Hsp60 ± SD. N = 3 biological replicates. See Supplementary data 8A for the gel. (C) ChIP and qPCR analysis of Mms1-Myc to seven BR in G1-, S- and G2-phase. Plotted are IP/input values as means ± SD. N≥ 3 biological replicates. In most cases Mms1 binds similar in G1, S and G2 phase. Statistical significance compared to cells arrested in G1 phase was determined by Student's t-test. *P < 0.05.

