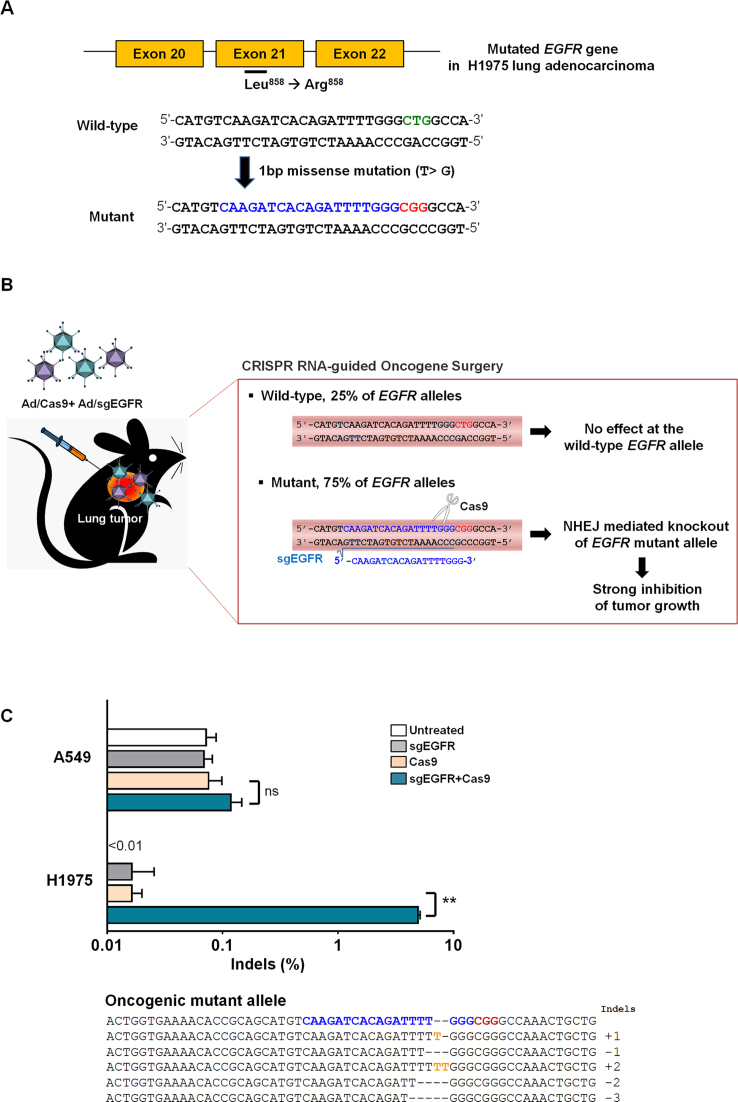
Figure 1.
Oncogenic mutant-specific Cas9. (A) A PAM sequence (red) is generated by a single nucleotide missense mutation in the EGFR gene. The corresponding wild-type sequence is shown in green. The sgRNA target sequence is shown in blue. (B) Diagram of selective cancer cell killing by cleavage of the oncogenic mutant allele 3-bp upstream of the PAM. (C) Mutation frequencies at the EGFR target site in H1975 cells or A549 cells co-transfected with Ad/sgEGFR and Ad/Cas9 48 h post-transfection. Mismatched nucleotides are shown in yellow and PAM sequences in red. The sgRNA target sequence is shown in blue. The column on the right indicates the number of inserted or deleted bases. Bars represent the mean ± S.E.M (n = 3). **P < 0.01, ns: not significant.

