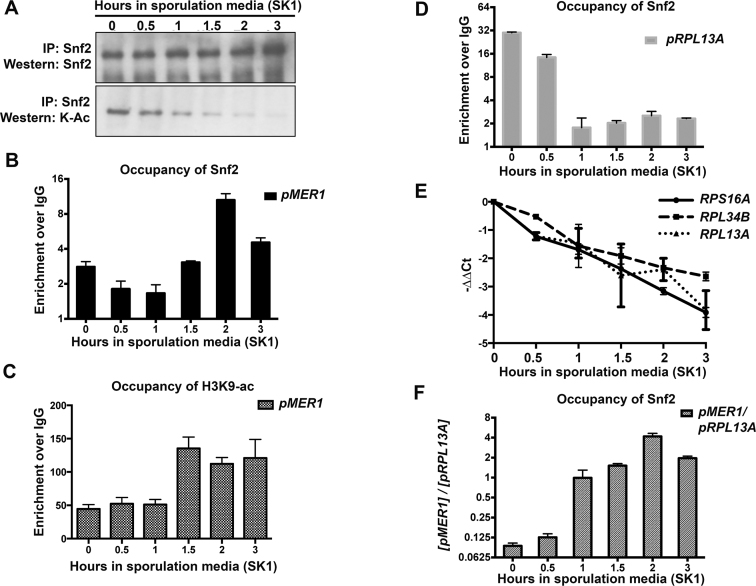
Figure 5.
The timing of Snf2 activity is coordinated by its acetylation and acetylation of histones. (A) Immunoprecipitation of Snf2 during a time course of meiosis in WT SK1 yeast. Snf2 acetylation decreases steadily between 0 and 3 h after transfer into sporulation media, but Snf2 levels remain constant. The immunoprecipitate at the 3-h time point is slightly overloaded (compare with Figure 4A) and acetylation is still barely detectable. (B) Bar graph showing Snf2 occupancy at the MER1 promoter in the SK1 strain over time. Error bars represent ± 1 SD. Quantification from three biological replicates. (C) Bar graph showing H3K9ac occupancy at the MER1 promoter in the SK1 strain over time in sporulation media. Error bars represent ± 1 SD. Quantification from three biological replicates. (D) Bar graph showing Snf2 occupancy at the RPL13A promoter in the SK1 strain over time. Error bars represent ± 1 SD. Quantification from three biological replicates. (E) Quantification of total (exon 2) transcript levels for RPS16A, RPL34B and RPL13A by RT-qPCR relative to scR1 and normalized to t = 0 in SK1 strain at indicated times after shift to sporulation media (part of Figure 4B). (F) Relative Snf2 occupancy at the MER1 promoter to an RPG locus, upon ChIP using an anti-Snf2 antibody, in a SK1 strain. Error bars represent ± 1 SD. Quantification from three biological replicates. Relative and absolute levels of Snf2 increases at the MER1 locus after transfer to sporulation media.

