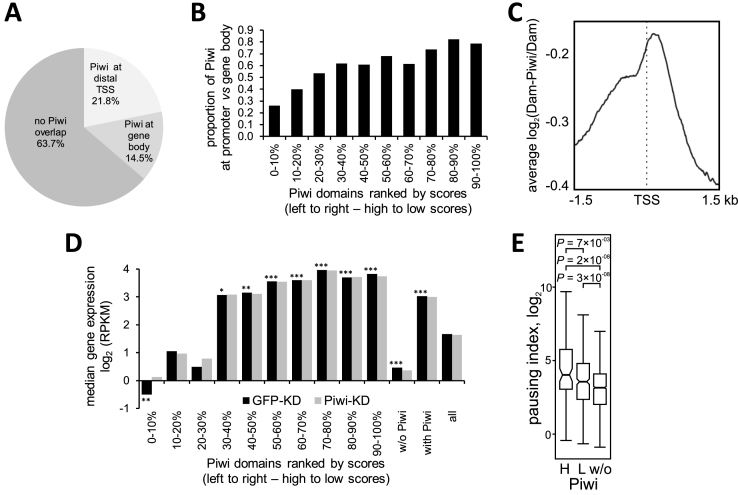
Figure 3.
Piwi domains overlap with protein-coding genes, demonstrating various levels of expression. (A) Pie chart for the Piwi domains, overlapping with protein-coding genes. (B) The ratio of promoter-overlapped to gene-overlapped Piwi domains, sorted by scores. (C) Averaged log2(Dam-Piwi/Dam) profile around the most distal TSSs for overall gene set. (D) Median expression levels in OSCs according to (12) for the genes, overlapping with Piwi domains (sorted by scores). Black bars – control cells (with gfp RNAi), gray bars – cells with piwi RNAi. ***P < 0.001, **P < 0.01, *P < 0.05. M–W U-test was used for the pairwise comparison of expression levels of the genes, overlapping with each Piwi domain subgroup, with the overall gene set (all). Significance is indicated for control cells (with GFP-KD) only. No significant difference was revealed between expression of corresponding gene sets in control and Piwi-KD cells. (E) Box plots showing Pol II-pausing indexes, calculated on the basis of Pol II ChIP-seq data in OSCs (7), for the genes, overlapping with the first three groups of high-scoring Piwi domains (H), or with the other low-scoring Piwi domains (L), or non-overlapping with Piwi domains (w/o). M–W U-test was used for the pairwise comparison of expression levels of the genes in high-scoring or low-scoring Piwi domains, with the genes outside Piwi domains.

