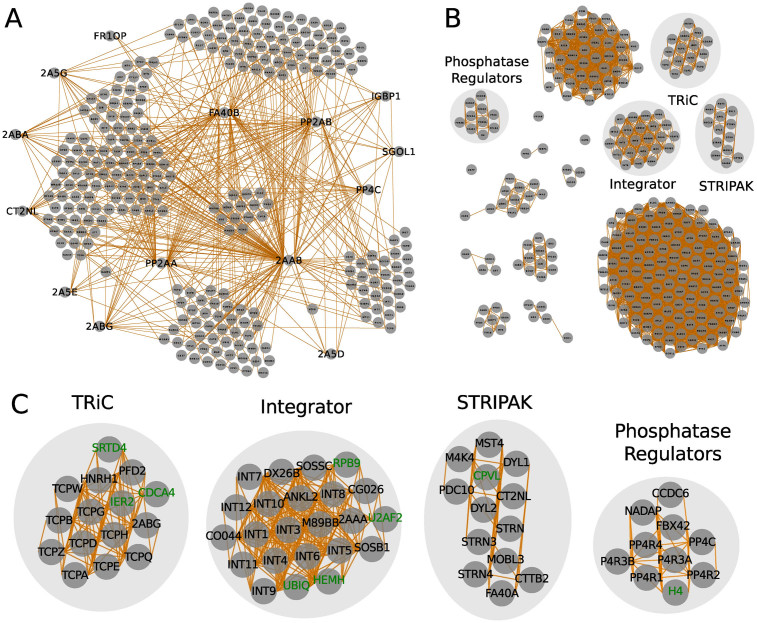
Figure 2.
PP2A complexes inferred from bait–prey interactions and abundance correlations. (A) bait–prey interactions of the PP2A network. Minimum relative abundance to the bait is 0.02 and the minimum enrichment over the negative control is 2.0. Proteins were grouped by a force-layout algorithm using relative abundances as measure for interaction strength and their inverse values as node-node initial distances. (B) PP2A complexes detected based on abundance correlations between preys. Correlation values >0.8 were considered as interactions. Proteins were clustered using the MCL algorithm, arranged by a force-layout algorithm using correlation values as interaction strength and the inverse values for node-node initial distances. (C) Zoom-in on complexes indicated in (B). Core subunits and interactors are depicted in black. Putative spurious interactions are shown in green.

