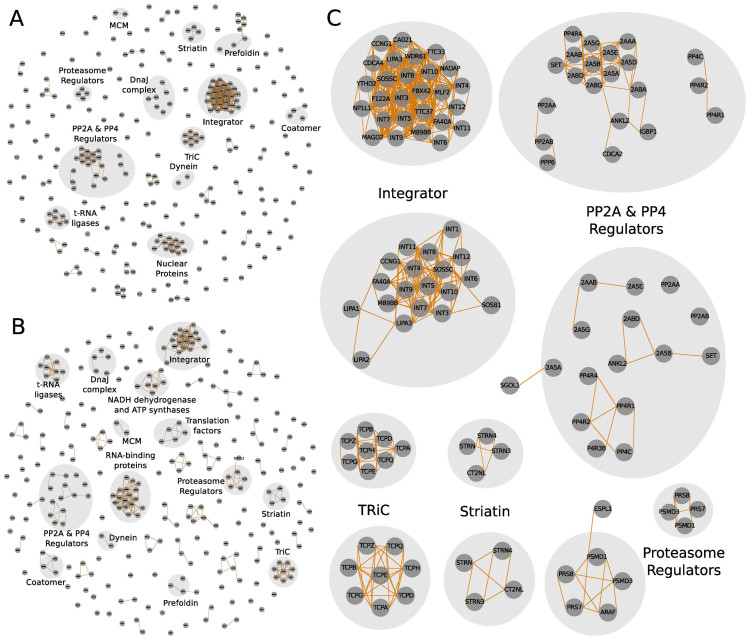
Figure 3.
PP2A complexes predicted based on GO functional similarities alone and in combination with abundance correlations. (A) PP2A complexes inferred from GO similarities. Similarity values >0.6 were considered as interactions. Proteins were cluster using the MCL algorithm and arranged by a force-layout algorithm as described in (2A). (B) PP2A network analysis by applying abundance correlations combined with GO functional similarities between preys. Combined values >0.65 were considered as interactions. Proteins were clustered using the MCL algorithm and arranged by force-layout algorithm using combined values as interaction strength and the inverse values for node-node initial distances. (C) Zoom-in on complexes detected in (A) and (B).

