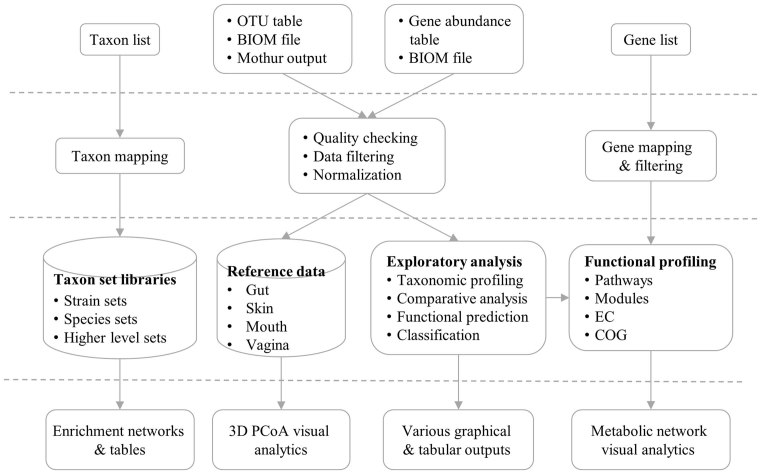
Figure 1.
MicrobiomeAnalyst flow chart. MicrobiomeAnalyst accepts taxa/gene lists, OTU/gene abundance tables, or BIOM files. Three consecutive steps are performed - data processing, data analysis, and result exploration. The associated web interface offers a rich set of options, and produces various tables and graphics to allow users to intuitively navigate the data analysis tasks.

