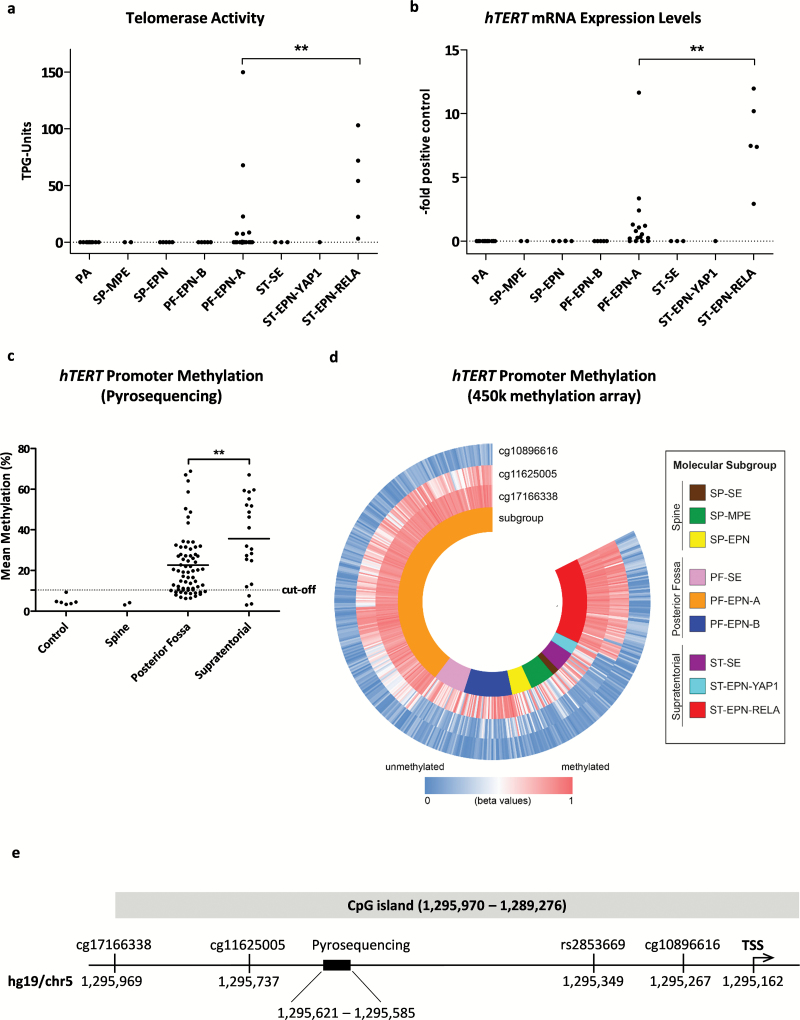
Fig. 1.
Telomerase activation in ependymoma. (A) Telomerase activity and (B) hTERT mRNA expression levels of pilocytic astrocytoma (PA), myxopapillary ependymoma (SP-MPE), spinal ependymoma WHO grade II (SP-EPN), posterior fossa group A (PF-EPN-A) and B (PF-EPN-B), supratentorial subependymoma (ST-SE), RelA fusion-positive (ST-EPN-RELA), and Yap1 fusion-positive (ST-EPN-YAP1) ependymomas. The dotted line at zero highlights negative samples. (C) hTERT promoter methylation stratified for tumor localization. (D) Methylation analysis of the hTERT promoter derived from 450k methylation array data, blue indicating low and red high DNA methylation and stratified for molecular subgroups (GSE65362, n = 500). (E) Map of the hTERT promoter showing the investigated regions. Sites are annotated according to hg19 (University of California Santa Cruz Genome Browser). Statistical analyses were performed by Mann–Whitney U test (**P < .01). The mean of each group is depicted as a solid line. TSS, transcription start site.

