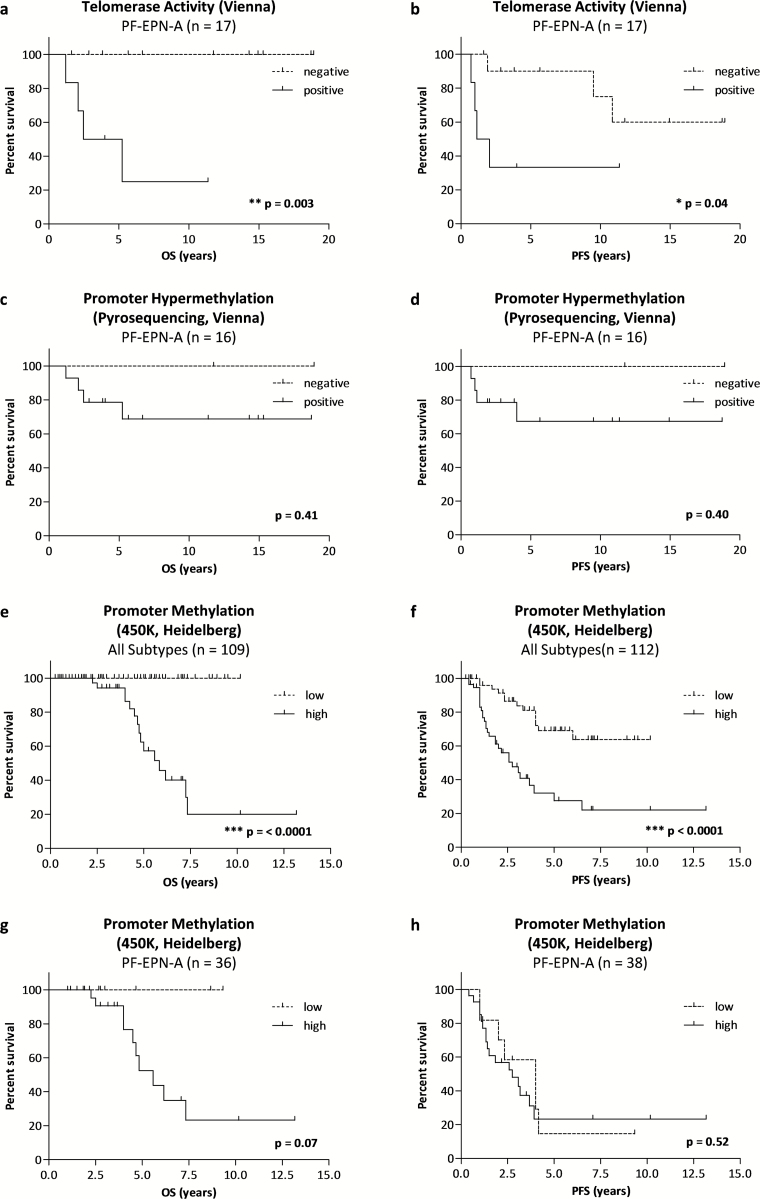
Fig. 3.
Prognostic value of telomerase-associated markers. Kaplan–Meier survival curves for OS (A, C, E, G) and PFS (B, D, F, H) within the respective patient subgroups. Survival curves for PF-EPN-A within the uniformly treated cohort (Vienna, n = 17) stratified for (A, B) telomerase activity and (C, D) hTERT promoter hypermethylation detected by pyrosequencing. Survival curves for PF-EPN-A within the validation cohort (Heidelberg, n = 112) stratified for methylation levels at the cg11625005 CpG site in all ependymoma subtypes (E, F), and restricted to posterior fossa group A (PF-EPN-A) (G, H). Tables of “numbers at risk” are summarized in Supplementary Table S4. P-values (log-rank test) are indicated.

