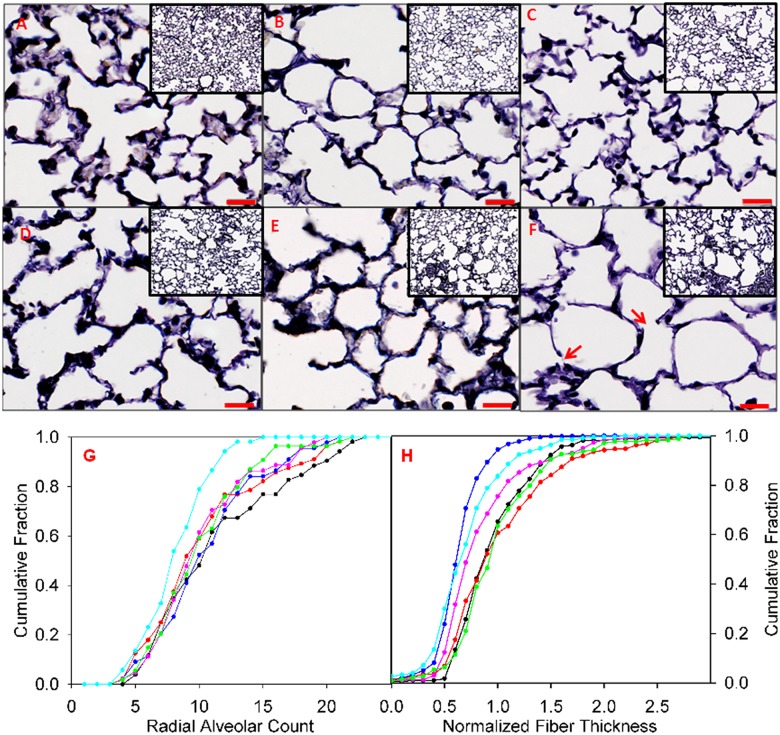
Fig 4. Lung tissue histology with quantification of radial alveolar count and normalized elastin fiber thickness.
Images A-F: Voerhoff’s stained lung tissue is presented at 400x in large image (bar = 20 um), with 100 x. inset. Cumulative frequency distributions of radial alveolar counts (G) and elastin fiber thicknesses (H) were obtained by pooling measurements across mice within each group. WT mice at 8 (black), 27 (red) and 80 week (blue), Sftpd-/- at 8 (pink), 27 (green) and 80 week (cyan). Red arrows indicate apparent breaks in the alveolar wall.

