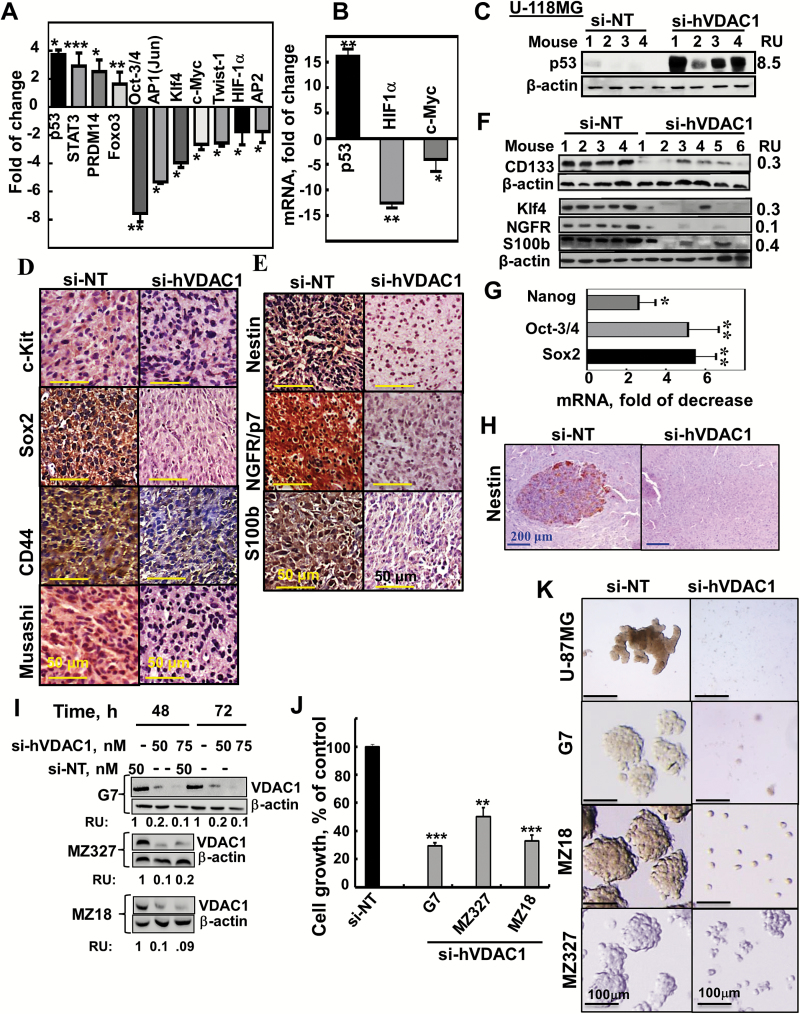
Fig. 5.
TF levels and stem cell marker expression are altered in si-hVDAC1-TTs and inhibition of cancer neurosphere formation. (A) Stem cell TF activation profiling was analyzed in s.c. U-87MG si-NT- or si-hVDAC1-TTs. (B) Analysis by qRT-PCR of p53, c-Myc, and HIF-1α mRNA levels in si-hVDAC1-TTs, relative to si-NT-TTs. Results = mean±SEM (n=3–5); *P ≤ .05; **P ≤ .01. (C) Immunoblot of p53 in si-NT-TTs and si-hVDAC1-TTs derived from U-118MG cells. (D, E) IHC and immunoblot (F) staining for stem cell markers and qRT-PCR analysis of Sox2, Oct3/4, and Nanog (G) of si-NT- or si-hVDAC1-TTs sections. Results = mean ± SEM (n = 3–5), *P ≤ .05; **P ≤ .01. (H) Nestin-stained sections from brains 22 days post-grafting treated with si-NT– or si-hVDAC1–treated U-87MG cells. (I–K) G7, MZ-18, and MZ327 cells were treated with si-NT or si-hVDAC1 and after 48 and 72 h, the cells were analyzed for VDAC1 levels (I) or cell growth using a sulforhodamine B assay (J). Results are the mean ± SEM (n = 3); **P ≤.01; ***P ≤.001. (K) Neurosphere formation in si-NT– or si-hVDAC1–treated U-87, G7, MZ-18 and MZ-327 cells in stem cell–specific medium.

