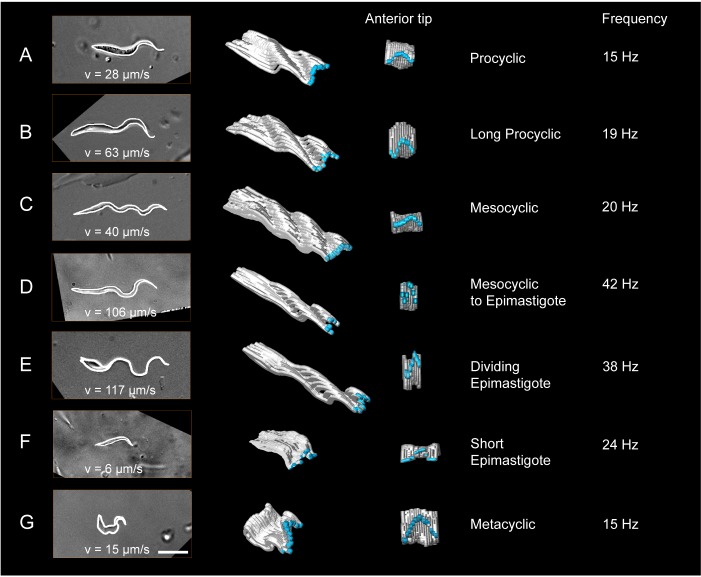
Figure 6. Measurement of the dynamic cellular waveforms of different trypanosome morphotypes.
Images in the left panel are stills from videos, captured with a frame rate of 250 fps. The speed (v in µm/s) represent the highest velocity reached during the video sequence analysed. The panel in the middle is a model of the outline for one single flagellar beat analysed frame by frame. The frames were stacked along the time axis in a three-dimensional surface representation, which allows the visualisation of the cellular waveform produced by the flagellum and the cell body in two different views. The flagellar tip was highlighted in blue. The model shows the travelling waves running along the cell body in a top-diagonal view and one wavelength of the flagellar beat in the view of the anterior tip. The frequency (Hz) of the analysed flagellar beat is shown on the right. Procyclic cells (A) and long procyclic cells (B) show similar waveform patterns, although the long procyclic cells generally swim faster. Mesocyclic cells (C) show a characteristic waveform due to their small amplitude during flagellar beating. When they start differentiating from mesocyclic to epimastigote cells (D), the amplitude increases again with a higher frequency and cells gain more speed. Dividing epimastigote cells (2K2N) (E) have proven to be the fastest swimmers of tsetse fly stages. Short epimastigote cells (F) are weak swimmers, despite beat frequencies similar to procyclic cells, due to their lack of a free flagellum. Infective metacyclic (G) cells show an increase in amplitude and a characteristic curly waveform, while reaching medium beat frequencies and swimming speeds. Video 6 contains all original video sequences selected for waveform analysis. The videos of trypanosome stages are consecutively played to show the position of each traced waveform along the time-axis in the 3D-models.

