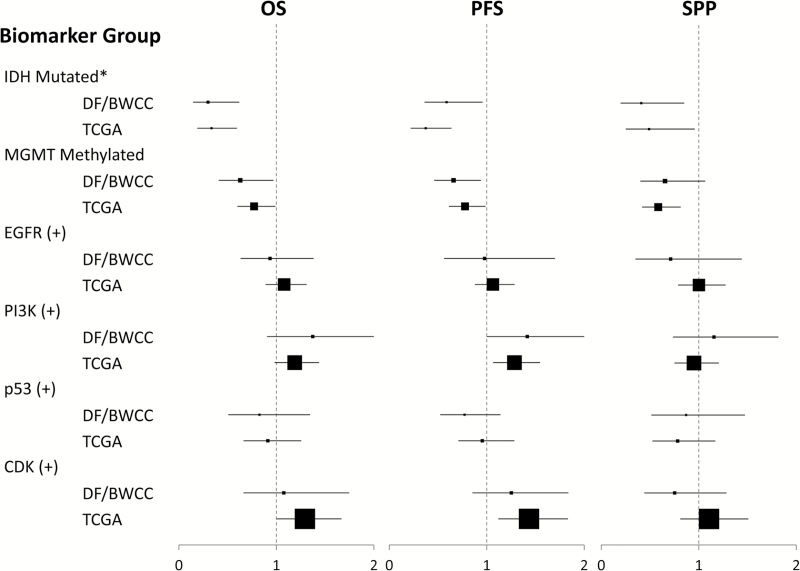
Fig. 2.
Hazard ratios for OS, PFS, and SPP by biomarker subgroups in TCGA and DF/BWCC patient cohorts. *Outcomes across IDH subgroups were compared across the entire cohort. Outcomes across remaining biomarker subgroups were compared across only trial-eligible GBM-patients (IDH WT). Hazard ratios are displayed for positive biomarker status relative to negative status as the baseline, with HR <1 representing a favorable endpoint. Point estimates for the HR are displayed by a square box, scaled to the representative sample size of biomarker (+) patients, with 95% CIs displayed in horizontal bars.

