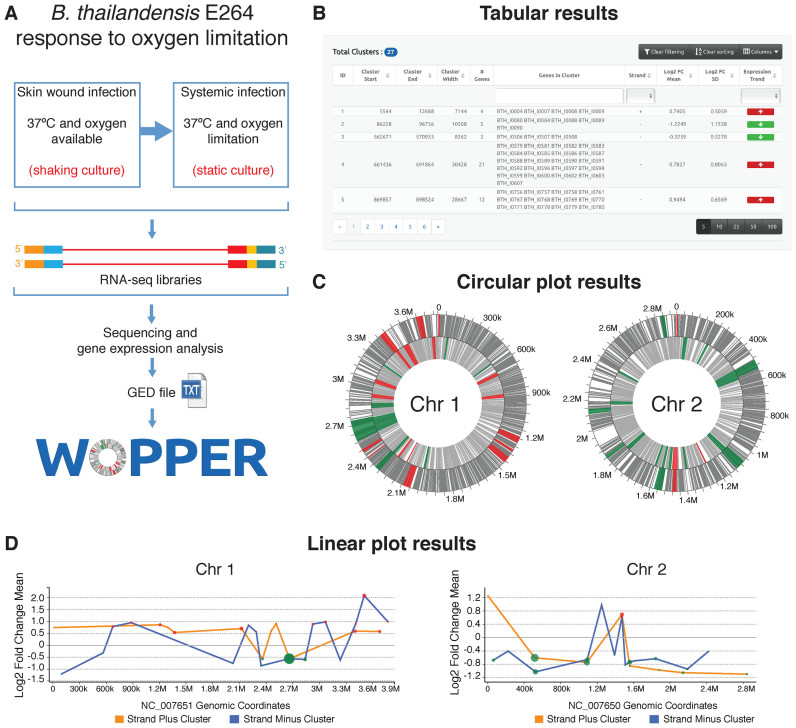
Figure 2.
Schematic representation of WoPPER analysis of RNA-seq Gene Expression Data (GED) by Peano et al. (29). (A) Gene Expression Data are obtained from an RNA-seq experiment in which Burkholderia thailandensis (E264 strain) response to growth in oxygen limiting condition was analyzed: i.e. growth at 37°C in static compared to shaking culture conditions. The experimental design and workflow are schematically represented. (B) Example of tabular output layout obtained by WoPPER. (C) Circular plots representing the two B. thailandensis chromosomes with genes (gray lines) and clusters plotted over chromosomal coordinates. Clusters identified by WoPPER analysis on separated strands are colored in RED (upregulated clusters) and GREEN (downregulated clusters). (D) Linear plot representations of the two B. thailandensis chromosomes in linear coordinates. Each colored red or green dot represents a cluster up- or downregulated, respectively: X-axis coordinate represents its middle position along the chromosome, Y-axis coordinate reports the average Log2FC for genes within each cluster, the dot size is proportional to the cluster width. An orange or blue line connects clusters identified on the plus or minus strands, respectively. Alternative color blind friendly color schemes for both the circular and linear plots can be interactively selected in the online interface.

