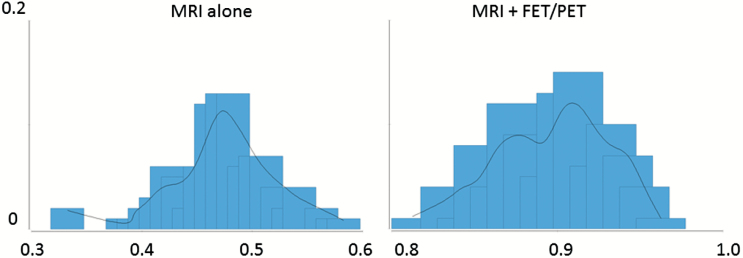
Fig. 2.
The figure illustrates the distribution of the results from the Monte Carlo statistics with regard to the effectiveness of an additional FET PET (MRI in combination with FET PET) compared with MRI alone. The x-axis depicts the likelihood of a correct diagnosis as outcome. The y-axis depicts the likelihood that this outcome is reached.

