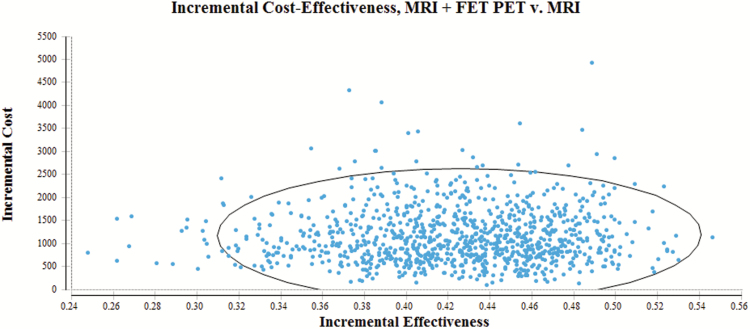
Fig. 3.
Distribution of results from Monte Carlo simulation (dots) with regard to incremental cost-effectiveness of an additional FET PET (MRI in combination with FET PET) compared with MRI alone. Within the circle are 95% of the values. The x-axis depicts the increase in likelihood of a correct diagnosis as outcome (incremental effectiveness). The y-axis depicts the increase in cost [€] (incremental cost).

