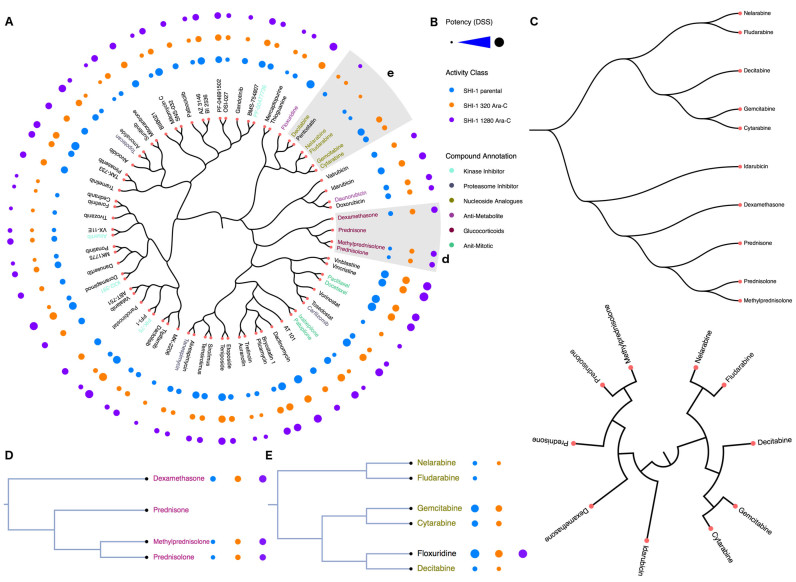
Figure 2.
(A) Compound-centric bioactivity dendrogram visualization of the example drug screening data (25). The drug panel contained a total of 250 compounds screened across three cytarabine-resistant SHI-1 cell-line variants (Parental, 320 Ara-C and 1280 Ara-C) to identify drugs that could counteract cytarabine resistance. A subset of 75 compounds were selected and their chemical space was visualized using the C-SPADE web-tool. The nodes are the compounds and the distance between the nodes represents the degree of their structural similarity based on the selected ECFP4 fingerprints. The bioactivity measurements (DSS) of each compound are represented as circles, where the radius of the circle is proportional to the bioactivity level. Inset: the distinct sub-clusters of glucocorticoids (d) and nucleoside analogues (e). (B) The provided bioactivities, activity classes and compound annotations, if available, are color-coded and displayed in the legend. (C) The types of dendrogram layouts and styles that are currently available in C-SPADE. The glucocorticoids (D) showed an increased sensitivity in the cytarabine resistant cell-lines, whereas the nucleoside analogues (E) showed a co-resistance pattern in the cytarabine resistant SHI-1 cells. In this example, C-SPADE enables the user to (i) map the chemical space of the compounds screened, (ii) explain the sub-clustering patterns that one commonly encounters in such drug-screening data analysis, and (iii) investigate and predict structurally similar compounds that cluster into a desired activity cluster prior to a future compound screening application.

