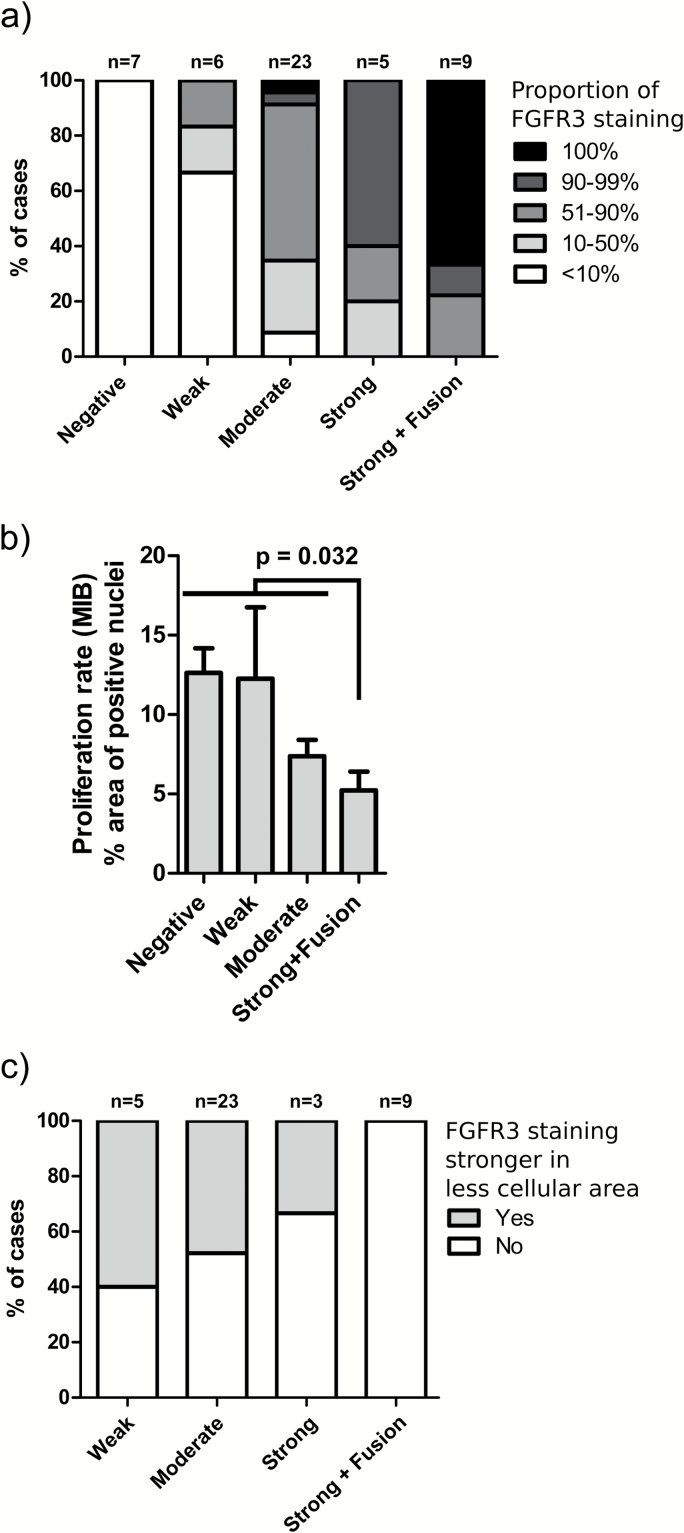
Fig. 4.
(A) The proportion of negatively stained tumor cells was generally lower in fusion-positive cases. P = 1.2 × 10⁻⁸, Fisher’s exact test. (B) Tumors with moderate to strong FGFR3 staining showed lower proliferation rate than negatively to weakly stained tumors (P = .0048, Kruskal–Wallis test). FGFR3 fusion-positive cases significantly differed from fusion-negative ones (P = .032, Mann–Whitney test). GBM samples with whole-mount tissue staining of FGFR3 were included in the analysis. Out of strongly stained samples, only fusion-positive cases were included due to low number of fusion-negative ones. The mean proliferation rate observed on TMA and SEM are shown. (C) FGFR3 staining was associated with lower cellularity within malignant regions in whole-mount tissue sections used for targeted sequencing, but this association was not observed in FGFR3 fusion-positive cases (P = .024, Fisher’s exact test).

