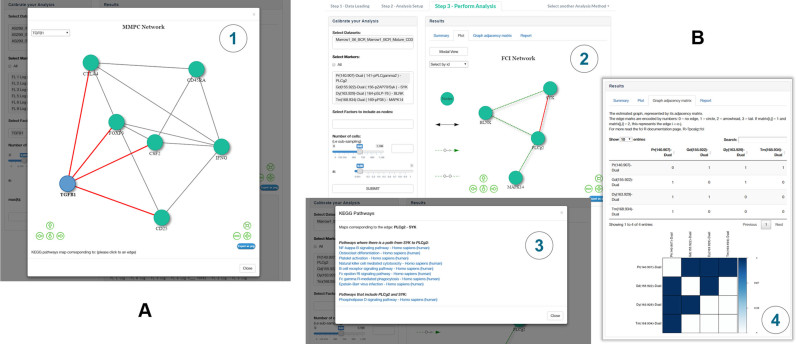
Figure 2.
Example use-cases. (A) iTreg cells and control T cells were cultured and pre-gated on live CD4+ T cells as described in Supplementary Figure S1, using a subset of three samples (s1, unstimulated; s2, control stimulation + IL-2; s3, iTreg stimulation + IL-2 + TGF-β). The given markers were included in the analysis and the protein network as reconstructed by the MMPC algorithm is depicted. (B) Network reconstruction results on the B cell antigen-receptor (BCR) signaling data after using the Fast Causal Inference (FCI) causal NR algorithm. There are several options to explore NR results in SCENERY. (3) By clicking on any reconstructed edge the user is informed with active links about all molecular pathways in the KEGG database that include the respective nodes. Here, the maps that correspond to the edge between PLCγ2 and SYK are indicated. (4) Graphs are also displayed in matricial form for the user's convenience.

