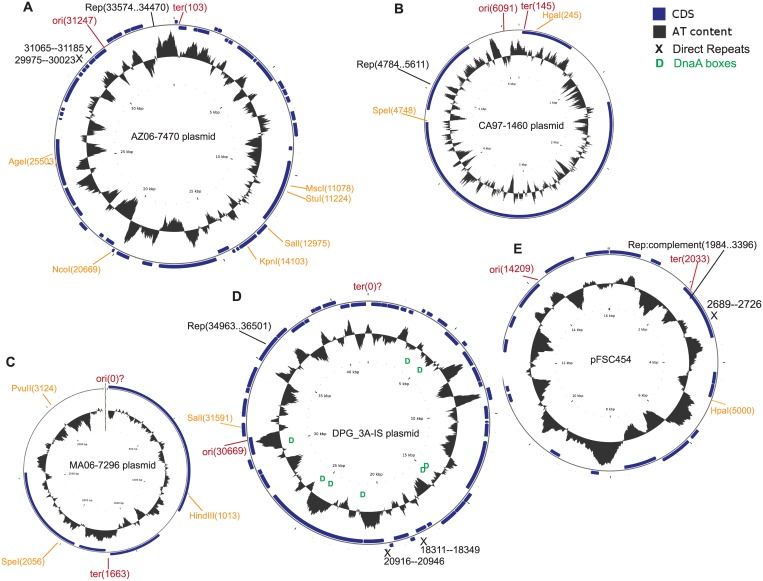
Fig 2. Circular maps of the (A) AZ06-7470, (B) CA97-1460, (C) MA06-7296, (D) DPG_3A-IS, and (E) pFSC454 plasmids.
Maps were drawn by the CGView software (http://wishart.biology.ualberta.ca/cgview/index.html). Restriction sites were identified by the addgene software (http://www.addgene.org), and are indicated on the maps by orange annotation; ori and ter regions were calculated by the GenSkew program and their approximate locations are marked in red. Approximate locations of direct repeats and DnaA box clusters are indicated by black Xs and green Ds, respectively.

