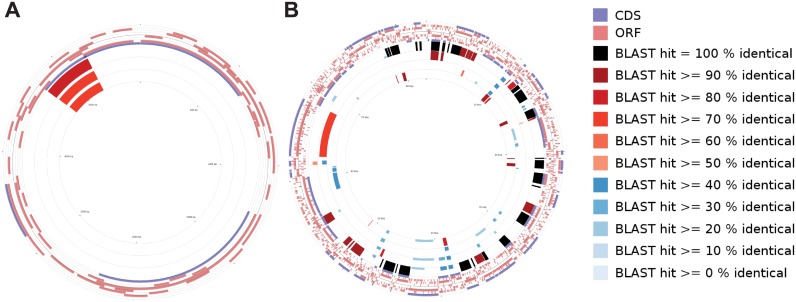
Fig 3. Plasmid maps drawn with the CGView comparison tool.
Panel A. F. philomiragia 25016 plasmid pF242 was used as the reference and compared to F. philomiragia GA01-2801 pFPK_2, the plasmid from A. guangzhouensis, and the F. philomiragia GA01-2794 plasmid. The outermost ring shows the coding sequences of the reference, the pink rings moving toward the center show the ORFs of the comparison plasmids (in the order pFPK_2, A. guangzhouensis, GA01-2794), followed by the reverse strand coding sequences of the pF242 reference. The inner rings represent BLAST hits of the reference coding sequences to each other plasmid in the order listed above. Panel B. TX07-6608 plasmid 3 was used as the reference for comparison to TX07-6608 plasmid 4, the DPG_3A-IS plasmid, pFNPA10, and the plasmid from AZ06-7470, with the rings representing the ORFs in this order from the outer edge toward the center. The tool will only show the ORFs from up to three comparison plasmids, so the ORFs from the AZ06-7470 plasmid were not included in the figure. However, the blast comparison rings are shown for all four of the comparisons, in the order listed above. The parameters for the BLAST comparisons were: minimum ORF length = 25, expect value = 0.1, minimum score = 25, number of hits to keep for each query = 50, minimum hit proportion (query coverage) = 0.3.

