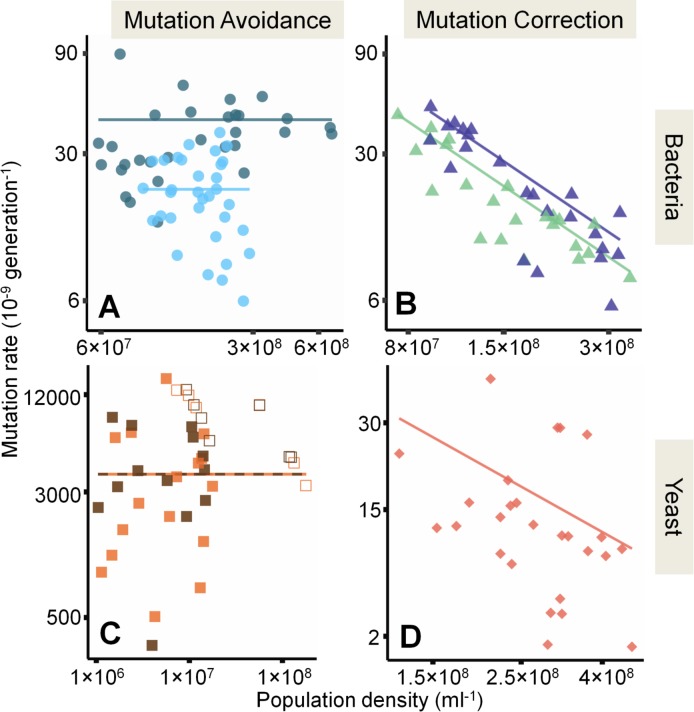
Fig 4. Density-associated mutation-rate plasticity (DAMP) in cells lacking mutation-avoidance or -correction genes in E. coli and S. cerevisiae.
(A) Mutation rates to nalidixic acid resistance in 2 independent E. coli ΔmutT strains that share no secondary mutations (JW0097-1 and JW0097-3 S3 Table), dark and light blue, respectively (Model S-VIII in S1 Text) (B) Mutation rates to rifampicin resistance in E. coli ΔmutM and ΔmutY strains (medium blue and light green, respectively), with equal slopes −1.1 (−1.2 to −1.04, CI) (N = 46, Model S-X in S1 Text) (C) Mutation rate to hygromycin B resistance in S. cerevisiae BY4742 and Sigma1278b PCD1-Δ strains (brown and orange, respectively, Model S-XII in S1 Text) (D) Mutation rate to 5-Fluoro-orotic acid (5-FOA) resistance in S. cerevisiae Sigma1278b MLH1-Δ (slope −1.22 [−1.44 to −1.01 CI], N = 26, Model S-XIV in S1 Text). Open shapes are as in Fig 2. Population density measured by ATP-based luminescence assay in (A) and (B) and via colony-forming unit (CFU) counts in (C) and (D). See also the main text for the slope estimates of the given lines. Note the logarithmic axes. Raw data are available in S1 Data.

