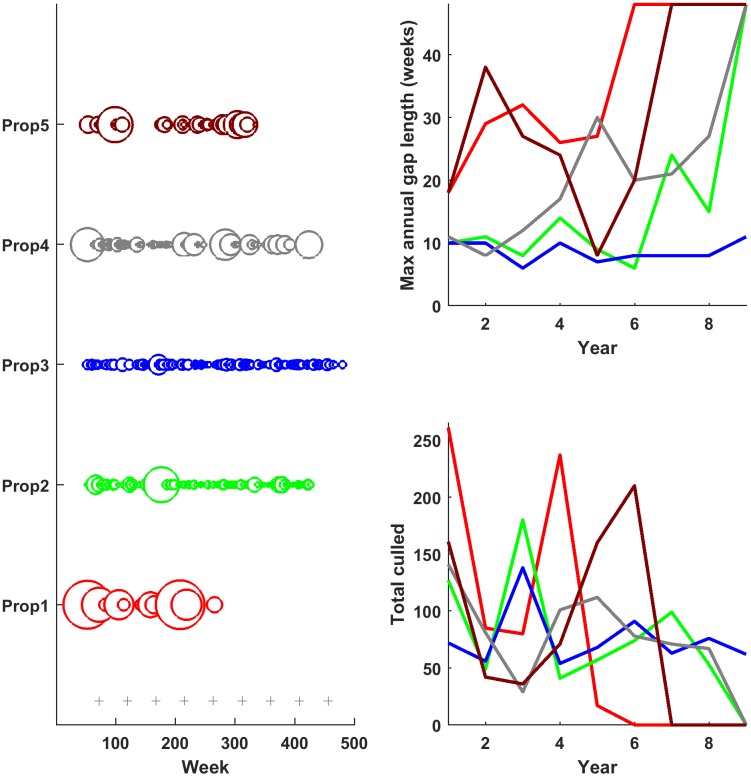
Fig 1. Five culling patterns.
A. Number of wild pigs culled (size of the circles) during each day of population management (X-axis) according to 5 culling patterns (labeled 1 to 5 on Y-axis). The largest circle corresponds to 171 wild pigs, the smallest corresponds to 1. Grey plus signs along the bottom indicate the timing of contraceptive control (hypothetical), if applicable. B. The maximum number of weeks with no culling during the year. C. Total culled per year. Total pigs culled by each method was 680. Line colors in B and C correspond to culling pattern labels in A.

