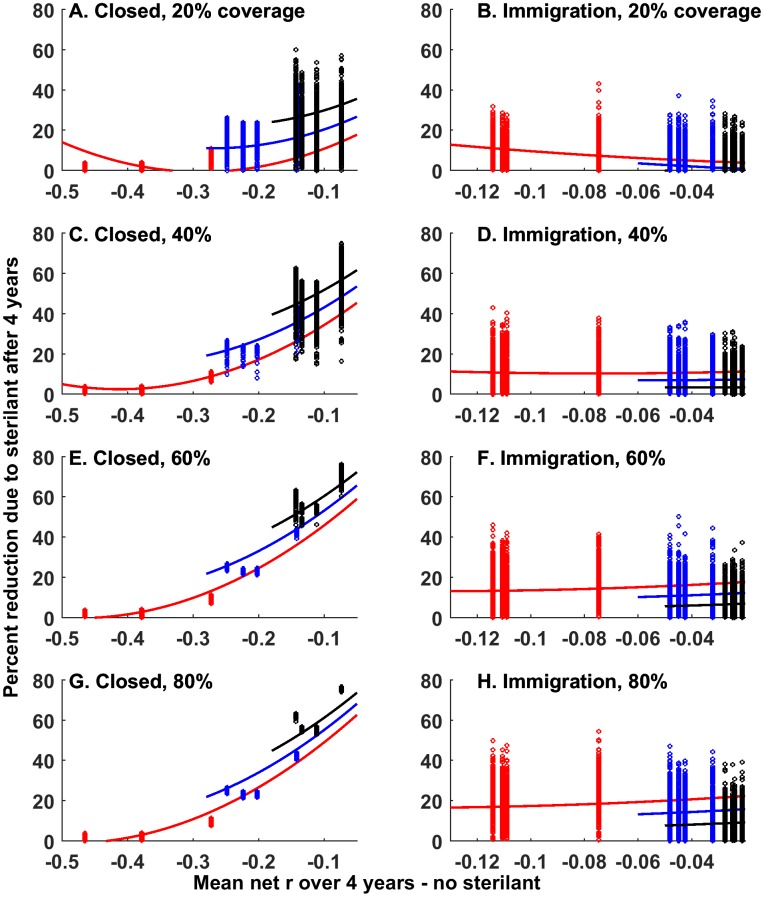
Fig 4. Effects of adding fertility control.
Percent reduction in abundance due to sterilant (i.e., relative to culling only) after 4 years as a function of different net population growth rates (note: negative r values due to culling). Each point represents one simulation. Lines are predictions from the model presented in Table C in S2 File. Predictions were truncated outside the range of the data. Colors indicate data from different intrinsic population growth rate parameters: Red: r = 0.26, Blue: r = 0.58, Black: r = 0.89. A, C, E and G columns are for populations closed to immigration, B, D, F and H columns indicate scenarios where immigration from neighboring populations occurs. Predictions are cut-off to avoid predicting outside the range of the data.

