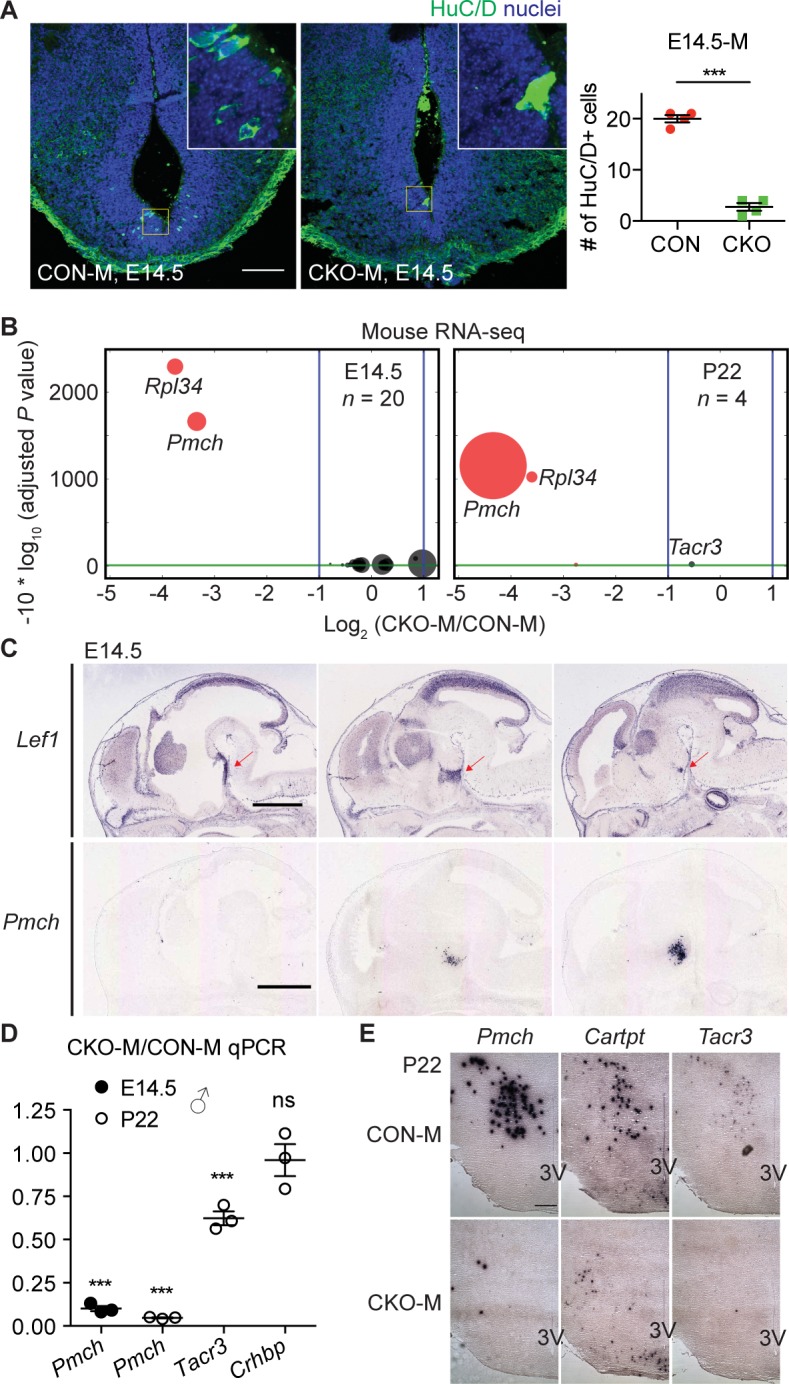
Fig 5. Hypothalamic Lef1 is required for Pmch+ neuron formation in mice.

(A) Immunostaining of HuC/D+ cells in the hypothalamic ventricular zone of E14.5 CON-M and CKO-M, with quantification shown on the right (n = 4). Images are z-projections of 16 μm confocal optical slices, shown with dorsal side on top, and higher magnification views of yellow squares in the insets. (B) Volcano plot of mouse RNA sequencing (RNA-seq) shows differentially expressed genes in the hypothalamus of CKO-M compared to CON-M at E14.5 (left) and P22 (right), using the same format as in Fig 2A. (C) E14.5 sagittal in situ hybridization images (www.genepaint.org) show expression of Lef1 (red arrows) and Pmch in the wild-type (wt) hypothalamus [26]. (D) Quantitative real-time PCR (qPCR) analysis for male shows hypothalamic gene expression in E14.5 and P22 CKO-M relative to CON-M. (E) P22 coronal in situ hybridization images show expression of Pro-melanin concentrating hormone (Pmch), CART prepropeptide (Cartpt), and Tachykinin receptor 3 (Tacr3) in the lateral hypothalamus. 3V, third ventricle. Data are mean ± SEM. ***P < 0.001, ns. P > 0.05 by unpaired Student t tests. Scale bars: 400 μm in (C); 30 μm in (E). Raw data can be found in S1 Data.
