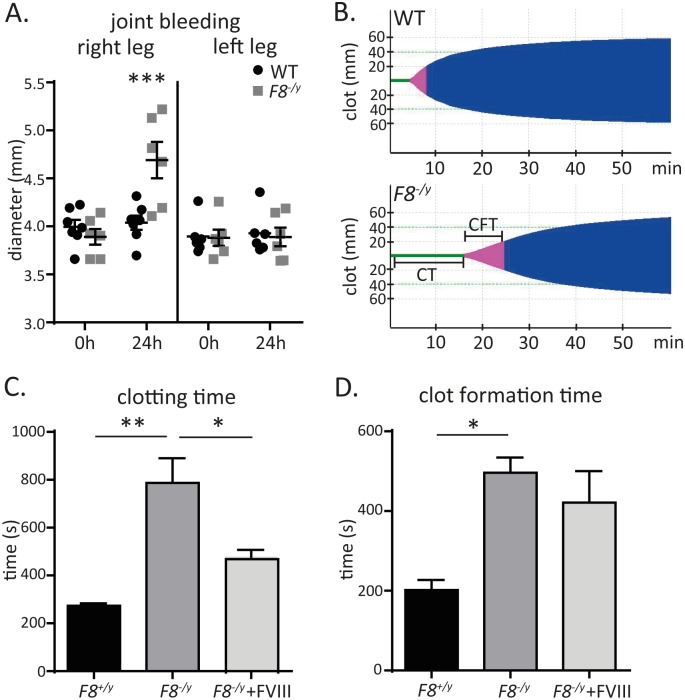
Fig 1. Bleeding phenotype of the F8-/y mice.
(A) Patella diameter before and 24h after joint bleeding induction to the right knee (n = 7,6) of C57BL/6J and F8-/y with the left knee (n = 6,6) set as a control. (B) Representative rotational thromboelastometry (ROTEM) graphs of a C57BL/6J and a F8-/y, illustrating clotting time (green), clot formation time (pink) and clot firmness (blue). (C) Clotting times and (D) clot formation times of C57BL/6J, F8-/y, and F8-/y blood samples reconstituted with 2.5 U/ml of human recombinant FVIII (n = 3). All data were expressed as means ± SEM. Statistical comparisons were performed using one-way ANOVA or two-way ANOVA * p< 0.05, ** p<0.01, ***p<0.001.

