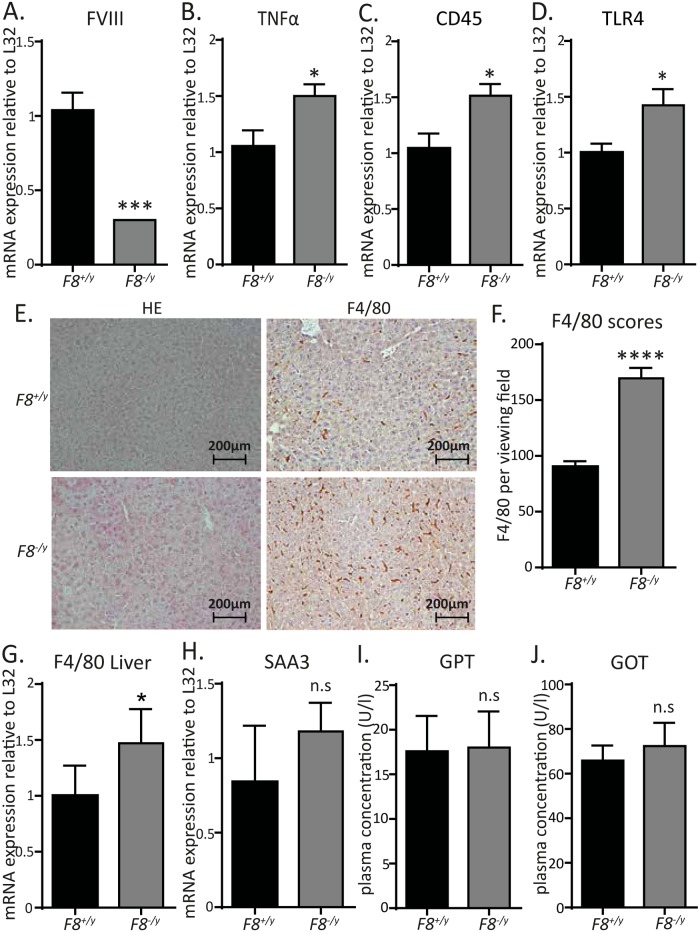
Fig 3. Low-grade inflammatory phenotype in the liver of F8-/y mice.
(A) FVIII (n = 5,4), (B) TNFα (n = 6,7), (C) CD45 (n = 7), and (D) TLR4 (n = 6,4) hepatic transcript levels of F8+/y (WT) vs F8-/y mice. (E) Representative hepatic tissue sections of F8+/y vs F8-/y stained with anti-mouse F4/80 antibody (200x magnification). (F) Visual scoring of the F4/80 stained hepatic tissue sections (n = 5). (G) Hepatic transcript levels of the macrophage marker F4/80 in F8+/y (WT) vs F8-/y mice (n = 4,7). (H) Hepatic SAA3 transcript levels in F8+/y (WT) vs F8-/y mice (n = 5,5). (I) Serum glutamate-pyruvate-transaminase levels in F8+/y (WT) vs F8-/y mice (n = 5,5). (J) Serum glutamat-oxalacetat-transaminase levels in F8+/y (WT) vs F8-/y mice (n = 6,5). All data were expressed as means ± SEM. Statistical comparisons were performed using the Student’s t-test, * p< 0.05, ***p<0.001, ****p<0.0001.

