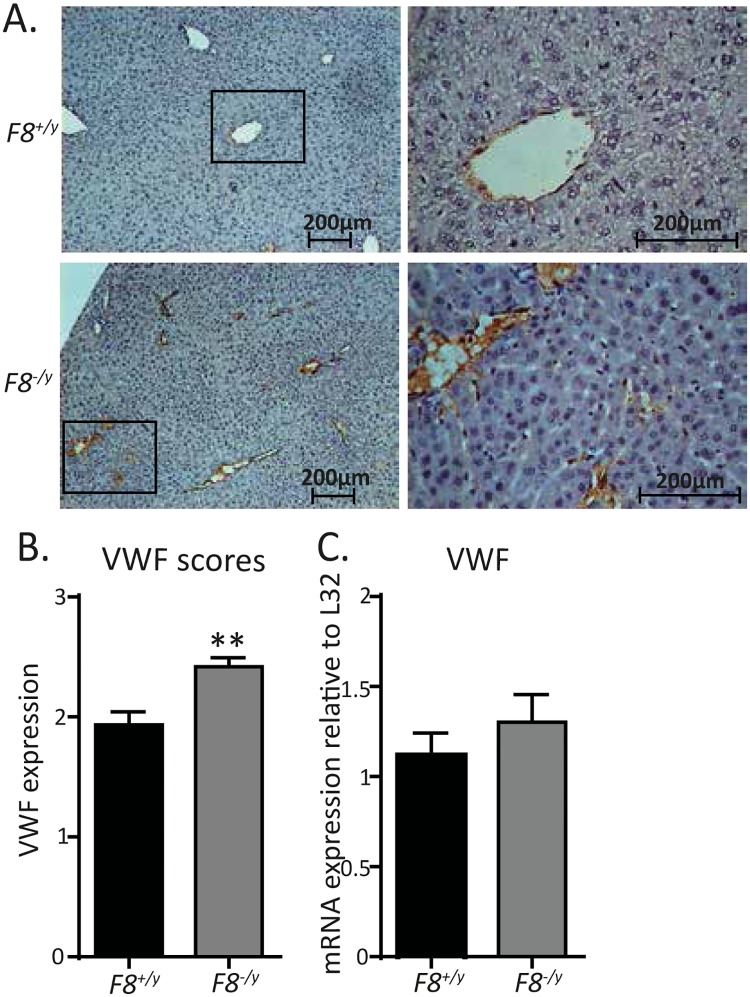
Fig 4. Increased VWF staining of the hepatic endothelium of F8-/y mice.
(A) Representative hepatic tissue sections of F8+/y (WT) vs F8-/y mice stained with anti-human VWF antibody (100x and 400x magnification). (B) Visual scoring of the VWF stained hepatic tissue sections of F8+/y (WT) vs F8-/y mice (n = 7,6). (C) Hepatic VWF transcript levels in F8+/y (WT) vs F8-/y mice (n = 4,7). All data were expressed as means ± SEM. Statistical comparisons were performed using the Student’s t-test, ** p<0.01.

