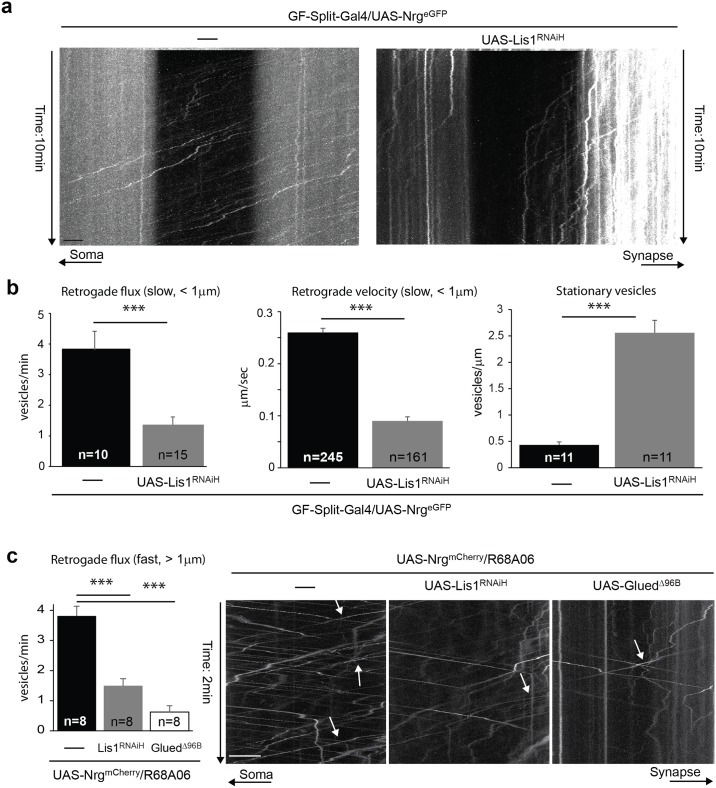
Fig 5. Retrograde trafficking of tagged Nrg in Lis1 knock down and GluedΔ96B mutant background.
(a) Axonal transport of NrgeGFP vesicles in GFs with postdevelopmental Lis1 knock down. Kymographs showing trajectory of NrgeGFP vesicles in a photobleached area flanked by unbleached areas in the GF axon over a 10 min time period. Videos were obtained at one frame per second. Ascending and descending slopes represent retrograde and anterograde vesicles, respectively. Vertical lines are stationary vesicles. Scale bar is 4 μm. (b) Quantification of NrgeGFP vesicles in wild type and in flies expressing UAS-Lis1RNAiH with GF-Split-Gal4. The lower expression, magnification and one frame per second imaging rate allows to quantify only slow (< 1μm/sec) moving NrgeGFP vesicles. The average flux (left graph) are the average numbers of retrograde vesicles that entered the photobleached area per minute, with n indicating the number of GFs analyzed. The maximum net displacement of retrograde NrgeGFP vesicles during the imaging period was analyzed and the average travel velocity was expressed in μm/second. Ten and 15 axons were assessed in wild type and Lis1 knock down background, respectively, with n indicating the number of vesicles analyzed. The average number of stationary vesicles per micron axon length was assessed in the unbleached regions. A total axon length of 169 μm and 180 μm was assessed in wild type and Lis1 knock down background, respectively, with n indicating the number axons analyzed. Error bars show standard error of the mean and significant differences are indicated with asterisks (*** = p<0.001, Kruskal-Wallis One Way Analysis Of Variance and Mann-Whitney Rank Sum Test). (c) Expression of NrgmCherry without and with UAS-Lis1RNAiH and UAS-GluedΔ96B using the R68A06 driver line. Left panel, quantification of fast (> 1μm/sec) retrograde vesicles in eight (n) GF axons of each genotype. Error bars show standard error of the mean and significant differences are indicated with asterisks (*** = p<0.001, Kruskal-Wallis One Way Analysis Of Variance and Mann-Whitney Rank Sum Test). Right panel, kymographs of NrgmCherry vesicles without and with Lis1RNAiH and GluedΔ96B expression. Videos were obtained at 4 frames per second and a 2 minute time period after phototobleaching is depicted. Some fast retrograde vesicles are indicated with arrows. Scale bar is 10 μm.

