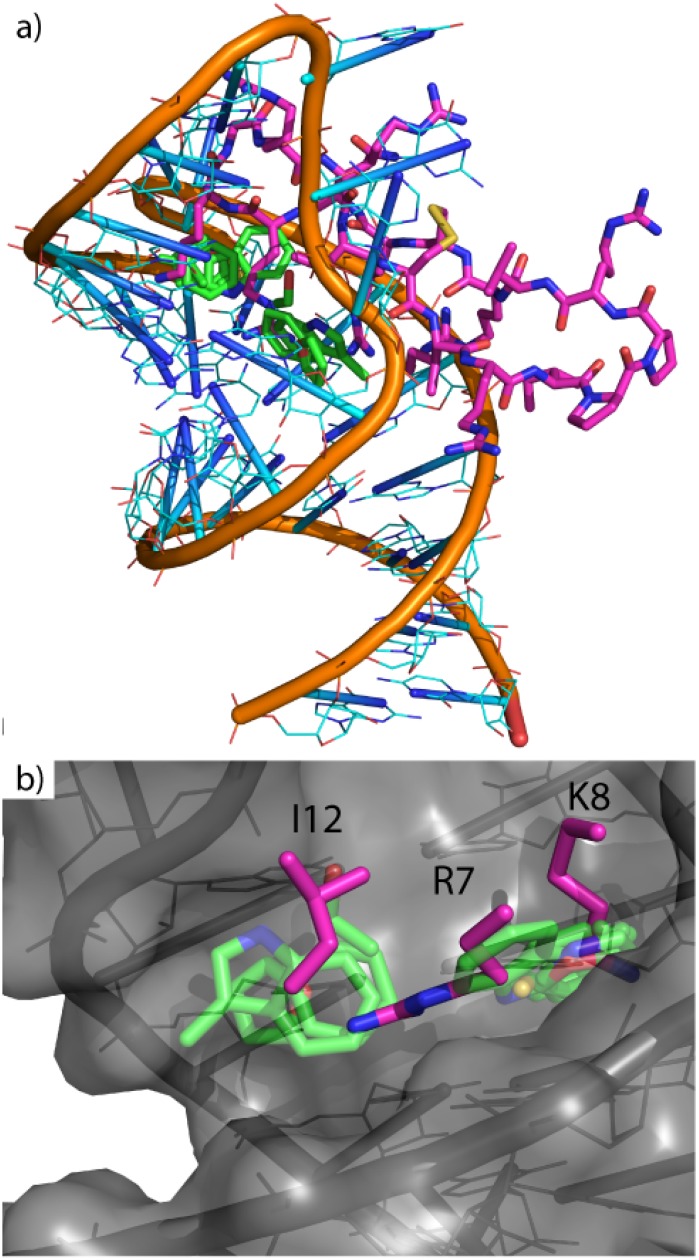
Fig 11. Hot spots on HIV TAR.
a) HIV RNA (orange backbone with cyan nucleosides) and TAT peptide (magenta carbons) with calculated clusters (transparent green carbons). b) Zoomed in and displays overlap of two clusters on residues I12, R7, and K8, which are the experimentally known key interactions.

