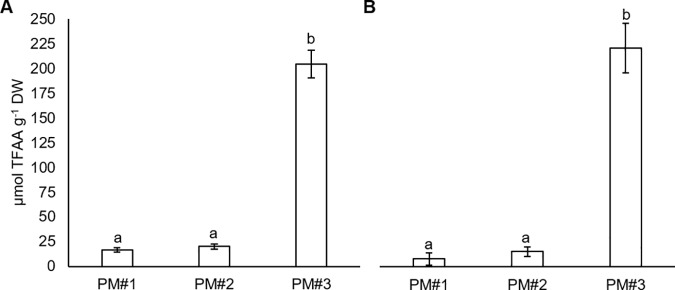
Fig 2. Total free AA pool concentration for PEMs grown on three different experimental media (PM#1–3).
(A) Cell lines 11:08:59, (B) 11:12:02. Each bar represents a mean ± SE; n = 5. Different letters above the bars in respective panels indicate significant differences between the treatments at P<0.05 (Tukey’s test).

