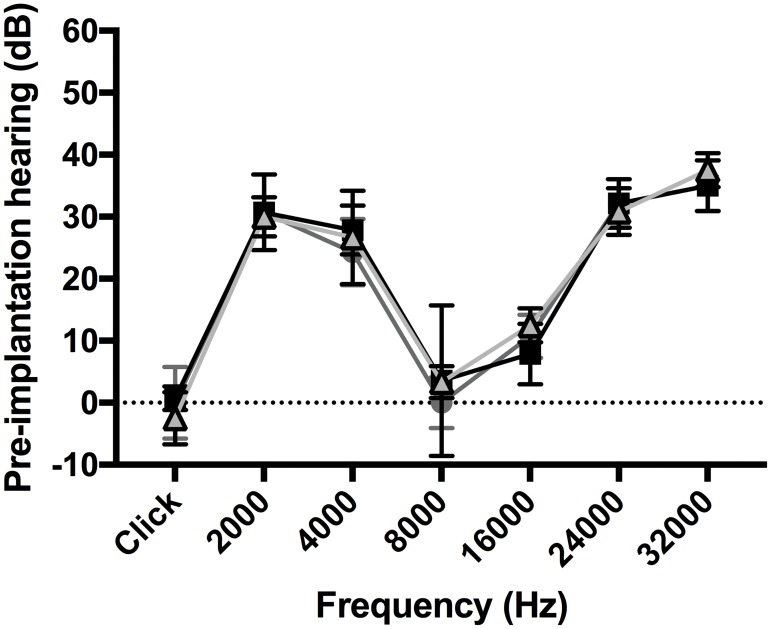
Fig 2. Pre-implantation hearing (dB) according to the electrode array.
Preoperative measurement according to the animal group: 0.4R (black squares) (n = 7), 0.4 (dark grey circles) (n = 7), and 0.3 (light grey triangles) (n = 6). Before implantation, the animals in the three groups had similar hearing thresholds (dB).

