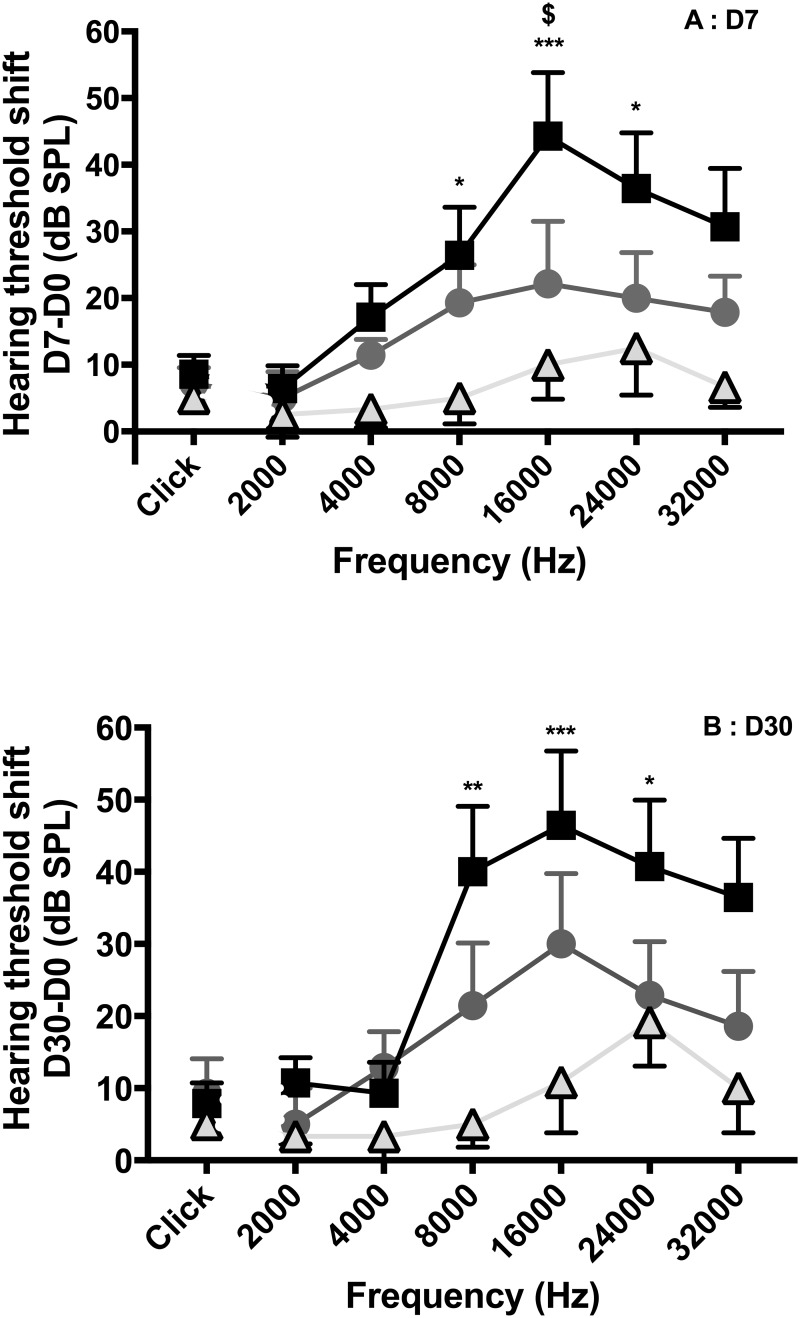
Fig 3. Hearing loss (dB) between D7 and D30 according to the electrode arrays.
Hearing threshold shift between D7 and D30 measurement according to the animal group: 0.4R (black squares) (n = 7), 0.4 (dark grey circles) (n = 7), and 0.3 (light grey triangles) (n = 6). At D30, hearing loss was unchanged compared to that at D7, and this applied to each group.

