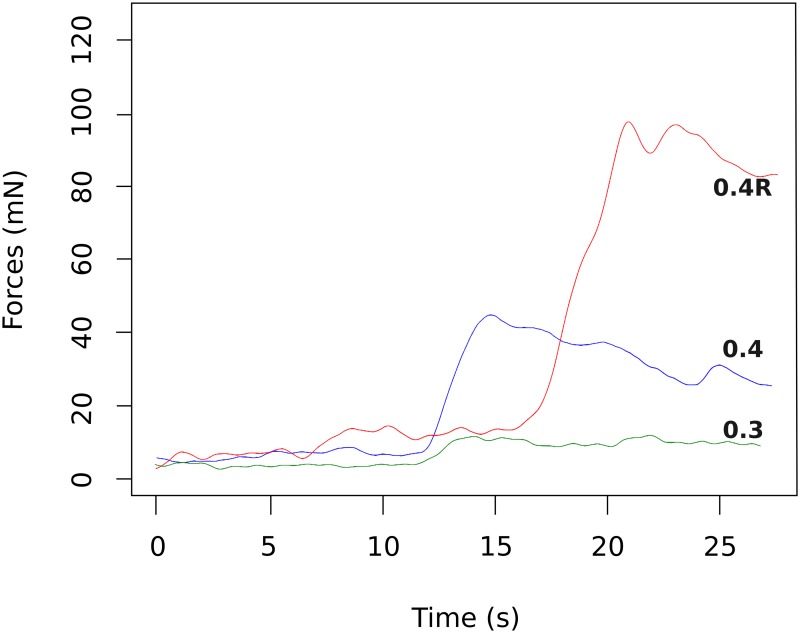
Fig 5. Array force insertions in mN (millinewtons) as function of insertion duration in a guinea pig model with three different array design.
Insertion forces remained low in the first half on the insertion and then slowly rose and reached a maximum with the three array design at the end of the insertion. In this example, a higher peak force with the 0.4R arrays (red) can be observed compared 0.4(blue) and 0.3 (green) array design.

