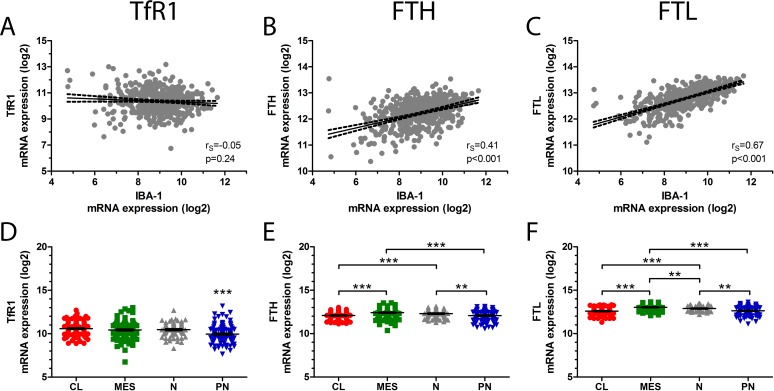
Fig 8. In silico analyses.
IBA-1 mRNA expression did not correlate with TfR1 mRNA expression (A), but showed positive correlation with both FTH (B) and FTL (C) mRNA expression levels. TfR1 expression was lowest in proneural GBMs (D), while FTH (E) and FTL (F) levels were highest in mesenchymal and neural GBMs. Error bars represent SEM. * corresponds to p<0.05, ** p<0.01, and *** corresponds to p<0.001. Abbreviations: CL classical, FTH ferritin heavy chain, FTL ferritin light chain, GBM glioblastoma, IBA-1 ionized calcium-binding adapter molecule 1, MES mesenchymal, N neural, PN proneural, TfR1 transferrin receptor-1.

