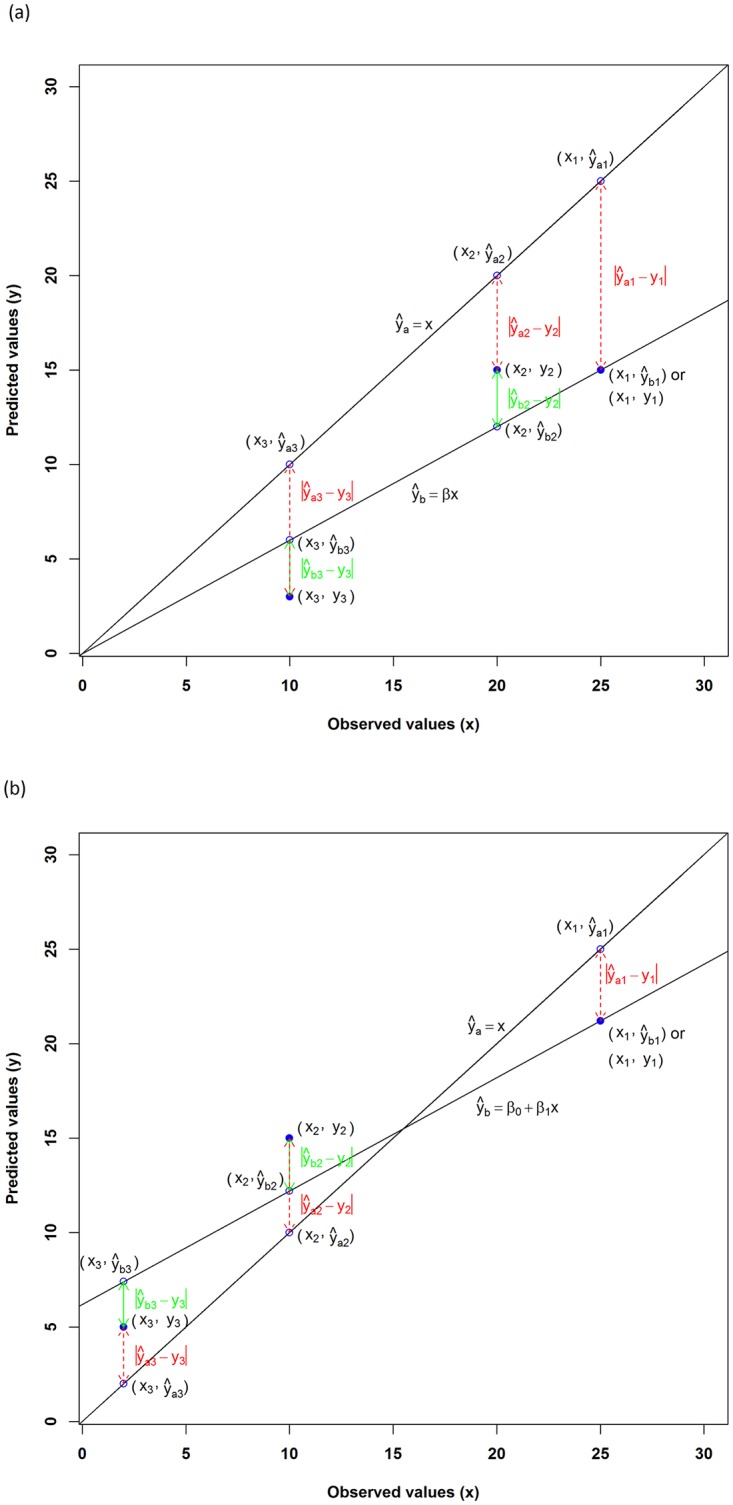
Fig 1. The relationship of the observed values (x) and predicted values (y), where fitted line ŷa = x, suggesting y and x are perfectly matched.

a) the fitted line ŷb = βx deviates from ŷa = x by (1 − β)x; and b) the fitted line ŷb = β0 + β1x deviates from ŷa = x by (1 − β1)x − β0. For each pair of predicted and observed values (i.e., (x1, y1), (x2, y2) and (x3, y3)), the green lines represent the distance between the fitted and predicted values used for calculating r, and the red dashed lines represent the distance between the predicted and observed values.
