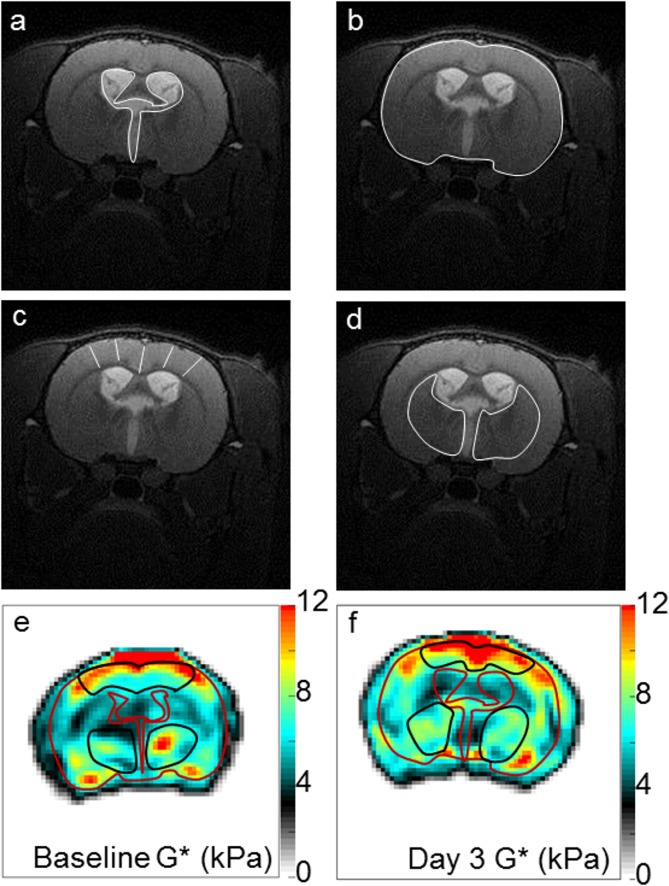
Fig 1. Regions of interest to characterise the effects of hydrocephalus on changes in brain structure size and stiffness in adult rats.
Changes in brain structure size were characterised using high resolution anatomical T2-weighted images by quantifying: a) ventricle size (i.e cross-sectional area of the ventricular system), b) head size (i.e cranial cross-sectional area), c) cortical gray matter thickness (from the pial surface to the subcortical white matter averaged over 5 locations) and d) caudate putamen cross-sectional area (sum of the right and left caudate-putamen). Brightness of the images was increased by 20% for visualization. White lines indicate each region of interest in a—d. Brain stiffness was then quantified by calculating the shear modulus (G*, kPa) at e) baseline and in f) day 3 in the cortical gray matter and the caudate putamen (black ROIs) using MRE performed at 800 Hz. For visualization, the outer boundary of the brain tissue and brain ventricle boundaries have been outlined in red on G* maps.

