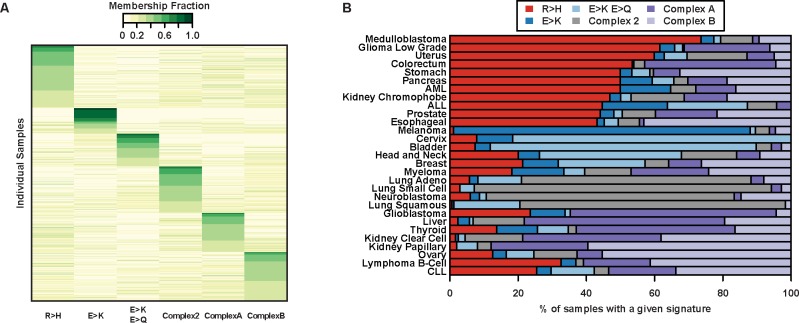
Fig 2. Amino acid mutation signatures for individual samples.
(A) A heatmap representation of the six-component NMF clustering results for individual cancer samples (only those with >10 total nonsynonymous mutations). Samples with the same maximum signature component were grouped and sorted. Four amino acid mutation signatures identified (R>H, E>K, E>K/E>Q, Complex 2) overlap with signatures in Fig 1A. Color scale represents scaled contribution of each signature for a given sample. Signature and NMF fit details can be found in S3 Fig. (B) Bars show the total fraction of individual samples with a majority of a particular signature within each cancer. Within cancers, a large fraction of individual samples tend to have similar signature components.

