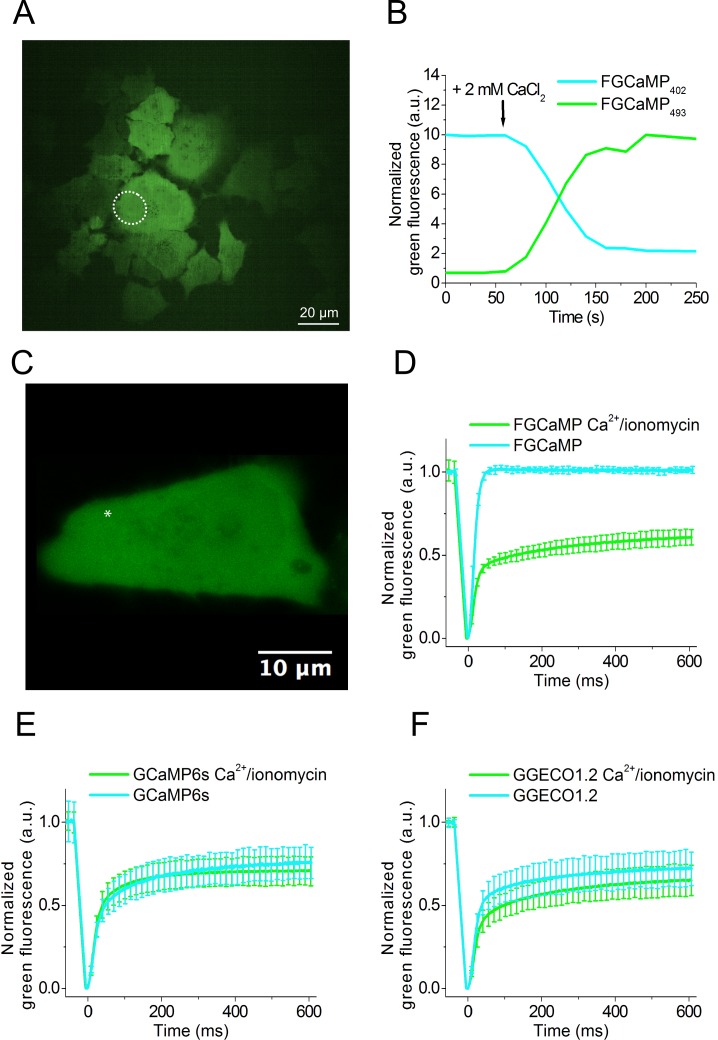
Fig 4. Response of FGCaMP to Ca2+ concentration changes in HeLa Kyoto cells and FRAP of FGCaMP and control GECIs at different Ca2+ concentrations in HeLa Kyoto cells.
(A) Confocal image of HeLa Kyoto cells expressing FGCaMP calcium sensor. (B) The graph illustrates changes in the green fluorescence of FGCaMP in HeLa Kyoto cells excited at 405 (cyan line) or 488 nm (green line) in response to the addition of 2 mM CaCl2 and 5 μM ionomycin. The changes correspond to the area indicated with white circles on the panel A. (C) Example of HeLa Kyoto cells expressing FGCaMP calcium sensor used for FRAP experiment. An example of FRAP area having a size of around 1 μm2 is indicated with a white asterisk. (D)-(F) The graphs illustrate FRAP induced changes in green fluorescence of FGCaMP and control GECIs at physiological Ca2+ concentrations and in response to the addition of 2 mM CaCl2 and 5 μM ionomycin. Error bars are standard deviations shown for each 20th dot on plots.

