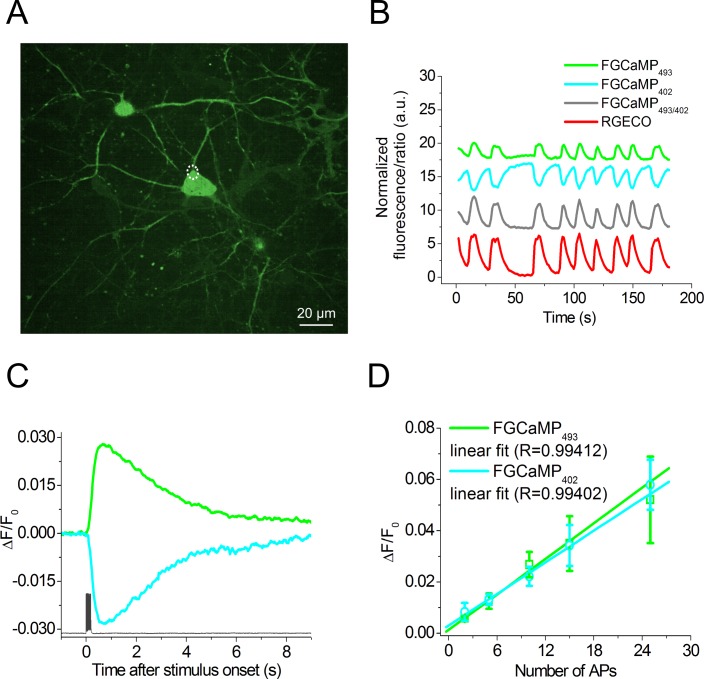
Fig 5. Response of FGCaMP to Ca2+ concentration variations as a result of spontaneous activity and to intracellularly induced APs in cultured neurons.
(A) Dissociated neuronal culture co-expressing FGCaMP and R-GECO calcium sensors. Red channel for R-GECO is not shown. (B) The graph illustrates changes in red fluorescence of R-GECO (red line, excitation 561 nm) and green fluorescence of FGCaMP for 402- (cyan line, excitation 405 nm) or 493-form (green line, excitation 488 nm) as a result of spontaneous activity in neuronal culture. The gray line represents the ratio between fluorescence intensities for FGCaMP in two channels with excitation at 488 and 405 nm, respectively. The graphs illustrate changes in fluorescence in the area indicated with a white circle. (C) Fluorescence changes in FGCaMP-expressing cells induced by the train of 10 APs (bottom) for 402- (cyan curve, excitation 400 nm) or 493-form (green line, excitation 470 nm). Ca2+ responses were averaged across all recorded neurons in different wells. An example of intracellular recording (dark gray) was taken from one cell. (D) Dependence of the amplitudes of responses induced by different numbers of APs in neurons expressing FGCaMP indicator recorded for 493- (green line, N = 7, excitation 470 nm) and 402-forms (cyan line, N = 7, excitation 400 nm). Note that in the range of 2 to 25 APs, the dependence is linear for both excitation wavelengths. Values are shown as the means ± SEM.

