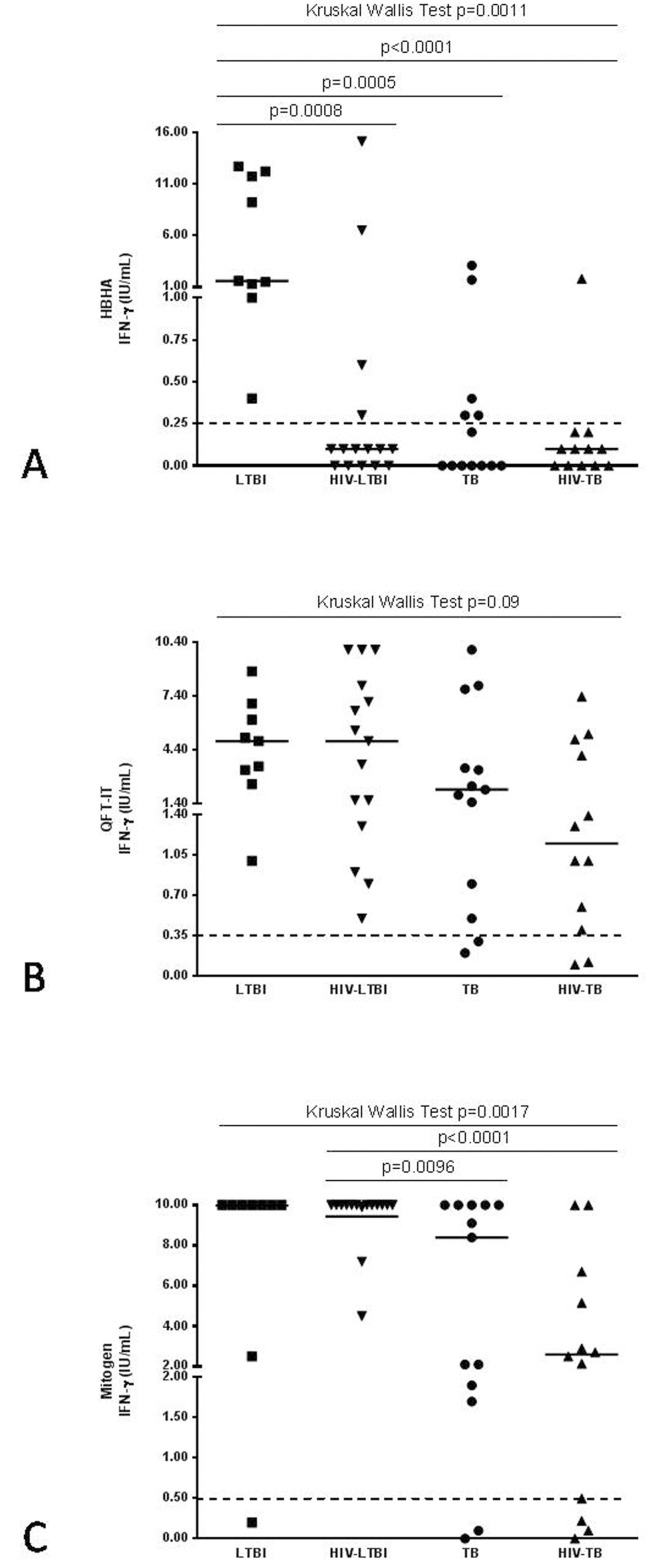
Fig 2. IFNγ-response to different Mtb-antigens in patients enrolled for the study.
IFNγ-response to different Mtb-antigens was evaluated by short-term stimulation of whole blood in Mtb-infected patients with or without HIV infection. IFNγ from day-1 supernatants were evaluated by commercial ELISA in response to HBHA (A), QFT-IT antigen (B) and Mitogen (C). The square represents LTBI group, the triangle with the bottom tip represents HIV-LTBI group, the dot represents active TB group and the triangle with the top tip represents HIV-TB group. The data are shown after the subtraction of the results obtained in the unstimulated samples. Horizontal lines indicate the median of IFNγ production. Dotted lines indicate the cut-off for either QFT-IT or Mitogen as indicated by the suppliers and for HBHA antigen as for previously shown results [24;25]. Footnotes: HIV: human immunodeficiency virus; TB: tuberculosis; LTBI: latent TB infection; HBHA: heparin-binding haemagglutinin; QFT-IT: QuantiFERON-TB Gold (QFT®) in tube; IFN: interferon; IU: International Unit.

