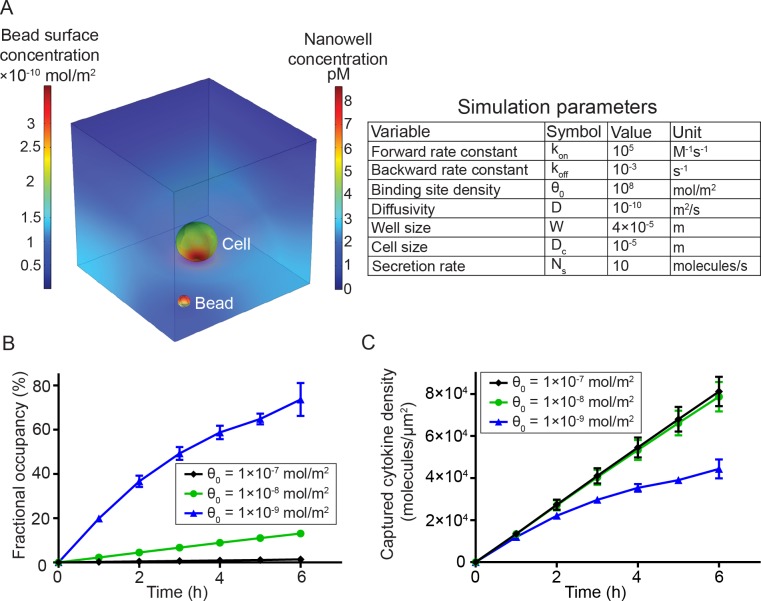
Fig 3. Finite element analysis to model the efficiency of capture of analyte secreted from single cells in open-well systems.
(A) Snapshot of heat maps showing analyte concentration in the liquid phase across the well (right) and on the bead surface (left) after 5 h of secretion in a 40 μm nanowell. The simulation parameters are shown in the table on the right. (B) Fractional occupancy of 5 μm beads as a function of incubation time when the binding site density was varied across three orders of magnitude. For a single-cell secreting at a constant rate, beads with the lowest binding site density possess the highest fractional occupancy. Mean±SEM is shown. Error bars were determined by varying bead and cell positions relative to each other (shown only if SEM is higher than 2.5%). (C) The variation in captured cytokine density obtained by varying the density of capture antibodies on the surface of the bead; beads with higher binding site density (θ0 = 1×10⁻⁸ mol/m2, 1×10⁻⁷ mol/m2) showed more concentrated cytokine-antibody complexes on the bead surface, thus likely leading to better fluorescent pixel intensity. Mean±SEM is shown. Error bars were determined by varying bead and cell positions and weren’t shown if SEM is lower than 1800 molecules/μm2.

