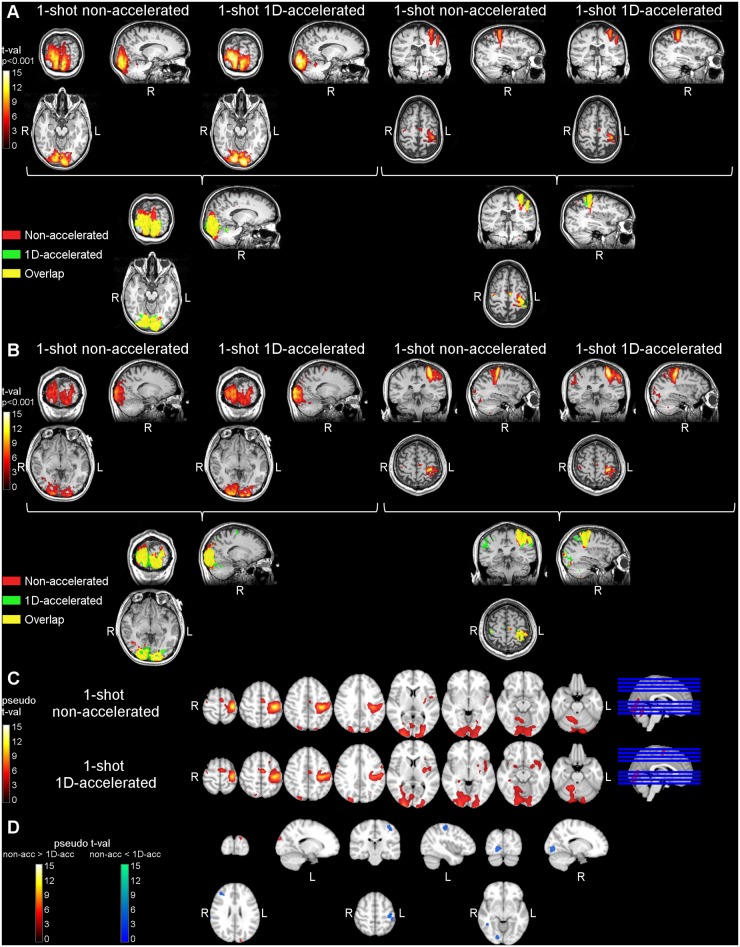
Fig 4. Results of the functional activation data analysis in Study 1.
Panels (A) and (B) show the task>rest activation clusters for two representative subjects, obtained with the non-accelerated and the 1D-accelerated data in both visual (left) and motor (right) areas. Panel (C) shows the group activation maps obtained with each readout type. Panel (D) shows the differences in activity across readouts. Non-accelerated data only presented higher activity than accelerated data in the white matter region below the left motor cortex cluster and above the primary visual cortex cluster, likely reflecting the effects of image blurring, while 1D-accelerated data presented higher differential activation within both clusters.

