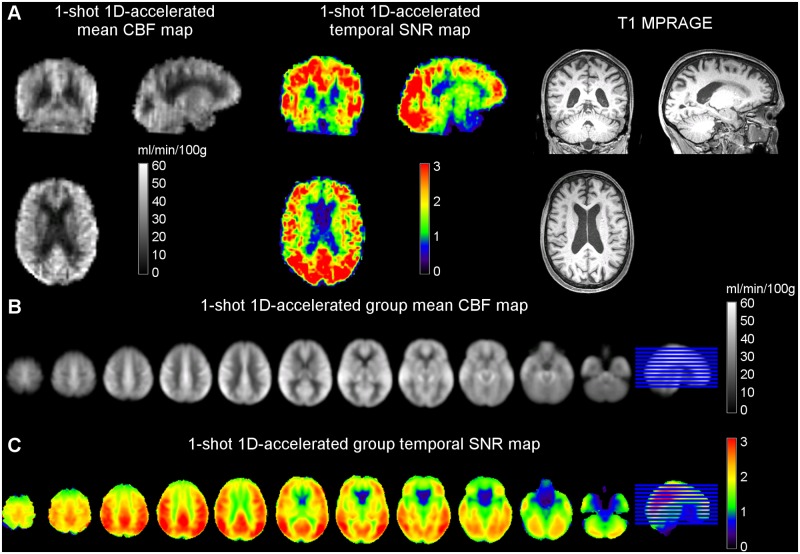
Fig 6. Mean CBF and temporal SNR maps of the Study 3 elderly cohort obtained from (A) a representative subject and (B) the group average after registration to MNI space and smoothing.
The lowest SNR values were found in orbitofrontal regions, due to the slight sensitivity of spiral readouts to T2* loses.

